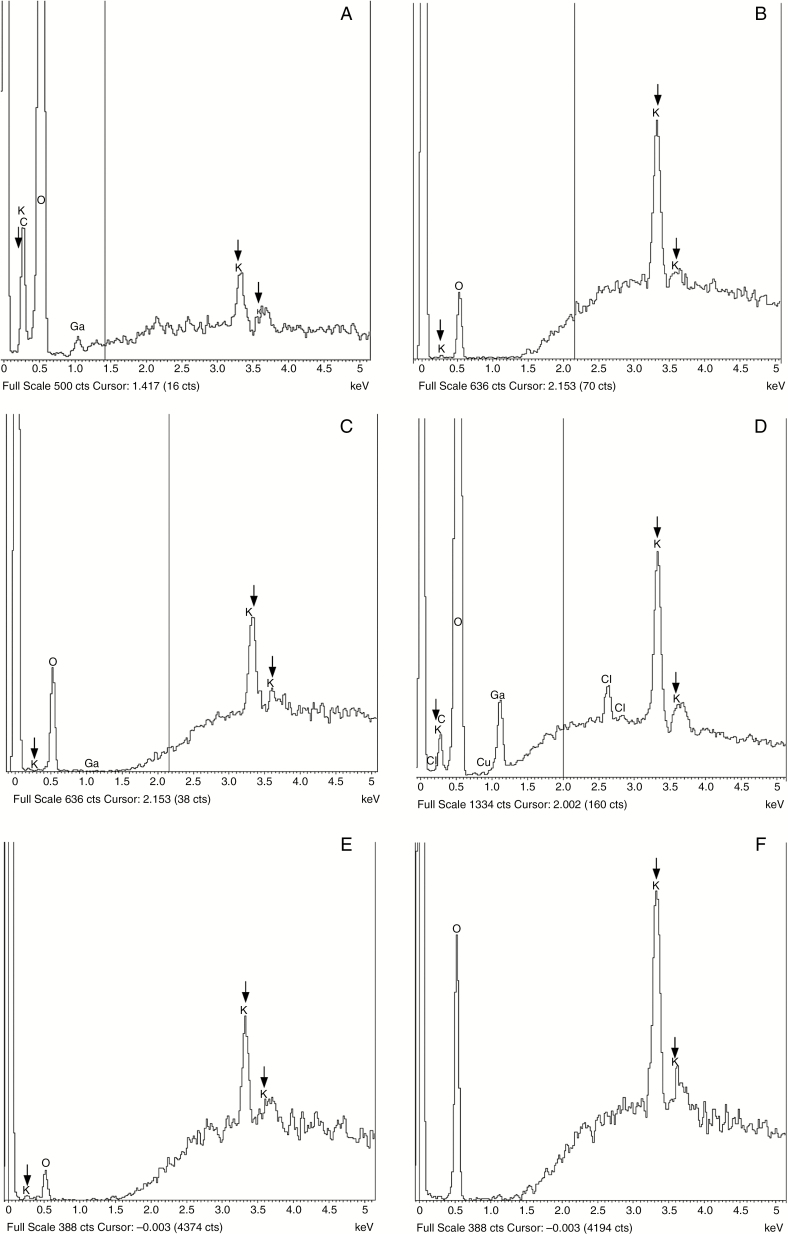
Fig. 3.
X-ray spectra from Phaeoceros laevis (A–D) and Anthoceros punctatus (E, F). Three vertical arrows indicate peaks attributable to potassium. (The peaks at 0.5 keV are gallium contamination from the ion milling.) (A) Low potassium peaks in a thallus epidermal cell (control). (B, C) The guard cell from an unopened stoma inside an involucre (B) has more pronounced potassium peaks than those in a newly opened stoma (C). (D) High potassium peaks in a guard cell of an open stoma after 4 h exposure to 100 µm ABA. (E) Guard cell in an unopened stoma. (F) High potassium peaks in a guard cell of an open stoma after 4 h exposure to 100 µm ABA.

