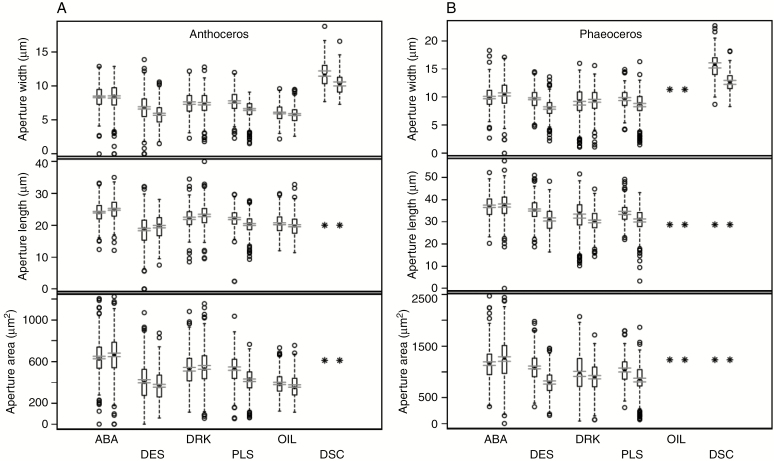
Fig. 4.
Box plots of measurements (width, length and surface area) on Anthoceros punctatus (A) and Phaeoceros laevis (B) in the experimental treatments and corresponding controls. The central bar is the median; the box defines the interquartile range (IQR); dashed ‘whiskers’ extend 1.5 IQR beyond the box; beyond that individual measurements are circles. The two parallel horizontal lines near the median define the 95 % confidence limits on the mean. To the left are controls which were kept moist and in light; to the right are experiment treatments: ABA, 100 μm for 4 h; DES, desiccated; DRK, in the dark for 15–24 h; PLA, plasmolysed; OIL, measurements made under oil (Anthoceros only); DCS, non-stomatal epidermal cells desiccated (Anthoceros only; cell widths only). Missing items are shown by an asterisk.

