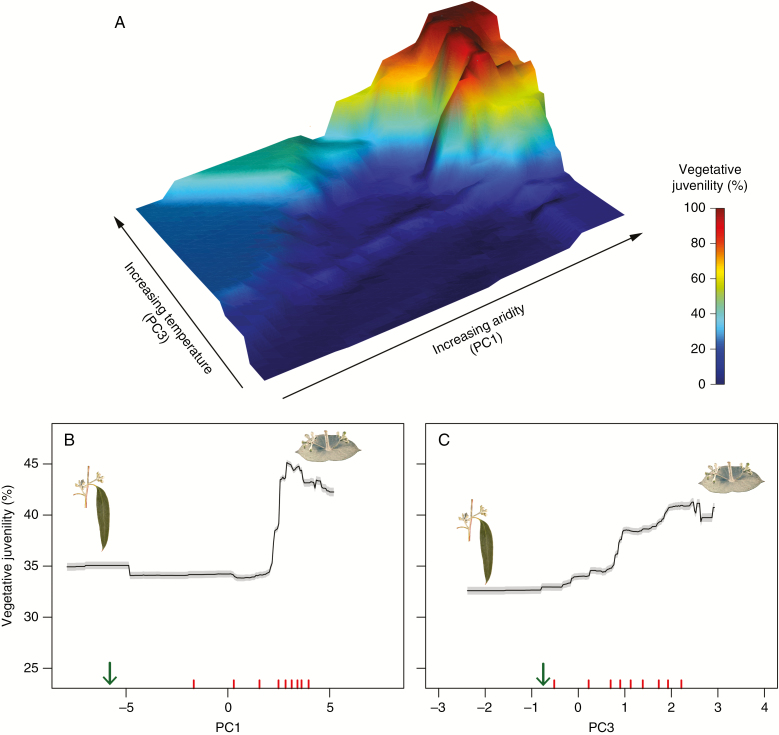
Fig. 2.
Partial dependency plots of the random forest model showing the marginal effect (see Supplementary Data Methods S3 for the description of a marginal effect) of the climate principal components 1 (PC1) and 3 (PC3) on the provenance values for mean effects of vegetative juvenility in the examined common-garden field trial. Three- (A) and two-dimensional (B and C) plots are provided for visualization. For plots B and C, the green arrow shows the location of the trial site along each principal component. Red tick marks show the deciles of the data. The grey shading indicates the 95 % confidence intervals derived by iterative bootstrapping (1000 bootstraps). Increasing scores on PC1 correspond to increasing home-site aridity (high maximum summer temperatures, high radiation and low rainfall), and increasing scores on PC3 correspond to increasing home-site temperatures in general (see Supplementary Data Table S2).

