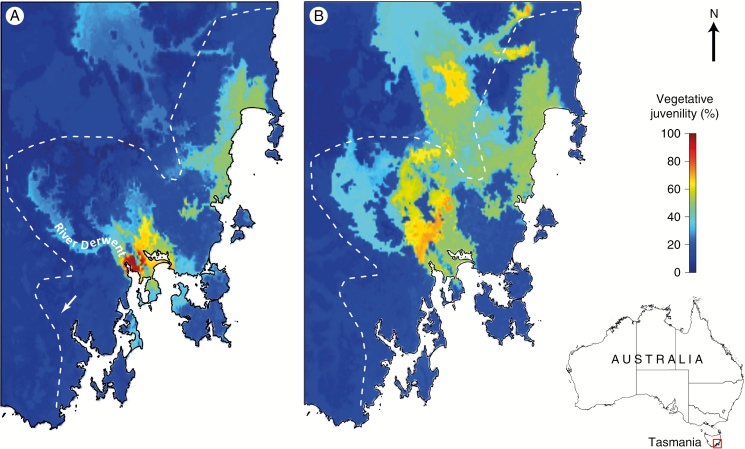
Fig. 3.
Spatial variation in vegetative juvenility across south-eastern Tasmania, as obtained from the random forest model (see also Supplementary Data Table S4) using climate data based on: (A) the contemporary (1976–2005) BIOCLIM surfaces; and (B) BIOCLIM surfaces projected for 2070–2099 using the ECHAM global circulation model (see Supplementary Data Methods S4 and Fig. S3). Also shown is the location of the common-garden field trial (tip of the arrow head) and the River Derwent. The contemporary distribution limit of the E. risdonii–E. tenuiramis complex is depicted by the dotted white line. The inset map shows the geographic position of the expanded region in Tasmania.

