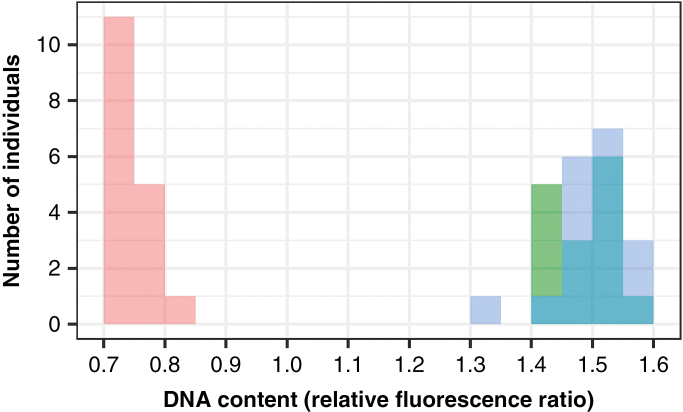
Fig. 1.
Distribution of DNA content for diploids (2x, red), neotetraploids (4xNeo, green) and naturally occurring tetraploids (4x, blue), determined through flow cytometry on dried leaf tissue. Overlaps between neotetraploid and naturally occurring tetraploid distributions are darker blue. DNA content is the relative fluorescence ratio of each sample peak to the internal standard.

