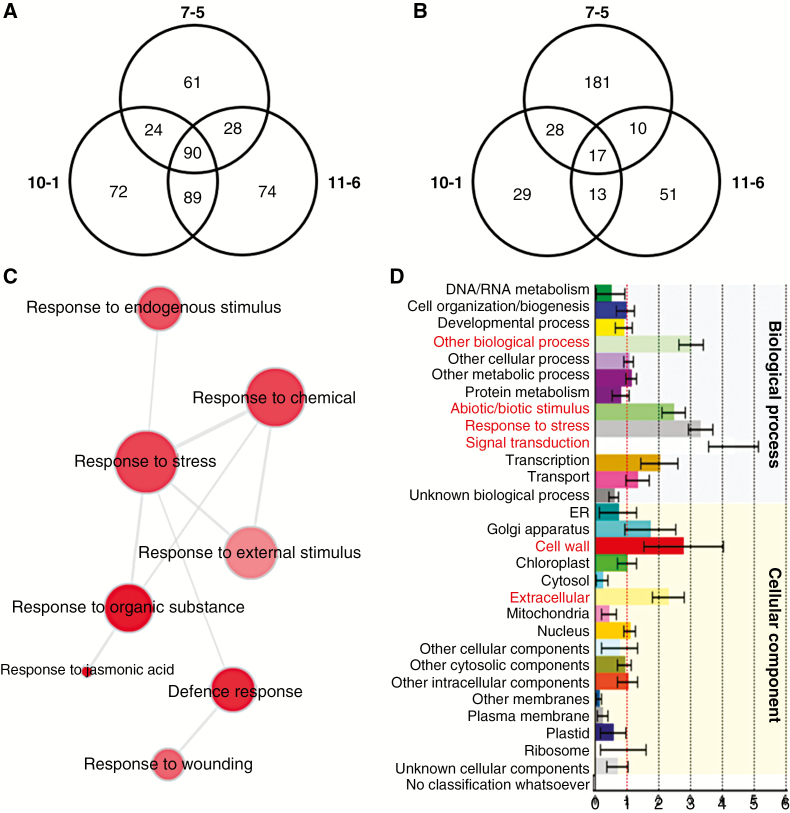
Fig. 7.
Whole transcriptome analyses of 7-d-old 35S::AtDICE1 plants compared to WT. (A and B) Venn diagrams showing differentially expressed probe sets from three independent lines (i.e. 7-5, 10-1, 11-6) of 35S::AtDICE1 plants compared to WT. The number of probe sets in each line is displayed within a circle. The number of common probe sets is shown in the intersections between lines. Upregulated (A) or downregulated (B) probe sets in each line compared to WT using a three3-fold change as the threshold. (C) Gene Ontology (GO) analysis performed using REVIGO (http://revigo.irb.hr/). The representative GO terms of the 90 upregulated probe sets of A are visualized in semantic similarity-based scatterplots. (D) Functional classification generated using the Classification SuperViewer (http://bar.utoronto.ca/ntools/cgi-bin/ntools_classification_superviewer.cgi). The Classification SuperViewer generates an overview of functional classification of the 90 upregulated probe sets of A based on the GO database. The input set was bootstrapped 100 times to provide an idea as to over- or underrepresentation reliability. Gene categories are shown on the left, and their normalized frequencies are found on the x-axis and are calculated as follows: (Number_in_Classinput_set/Number_Classifiedinput_set)/(Number_in_Classreference_set (25k)/Number_Classifiedreference_set).

