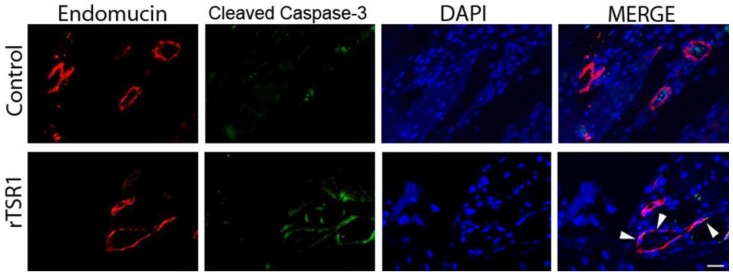
Figure 5.
The rTSR1 induced apoptosis in tumor endothelial cells. Representative microscopic images show the increased apoptotic endothelial cells in an rTSR1-treated tumor compared to the control. Red indicates the endothelial cells (endomucin-positive) and green indicates the cleaved caspase-3-positive cells. DAPI was used as the nuclear counter stain. The arrow heads indicates the cleaved caspase-3-positive endothelial cells. Scale bar: 20 μm.

