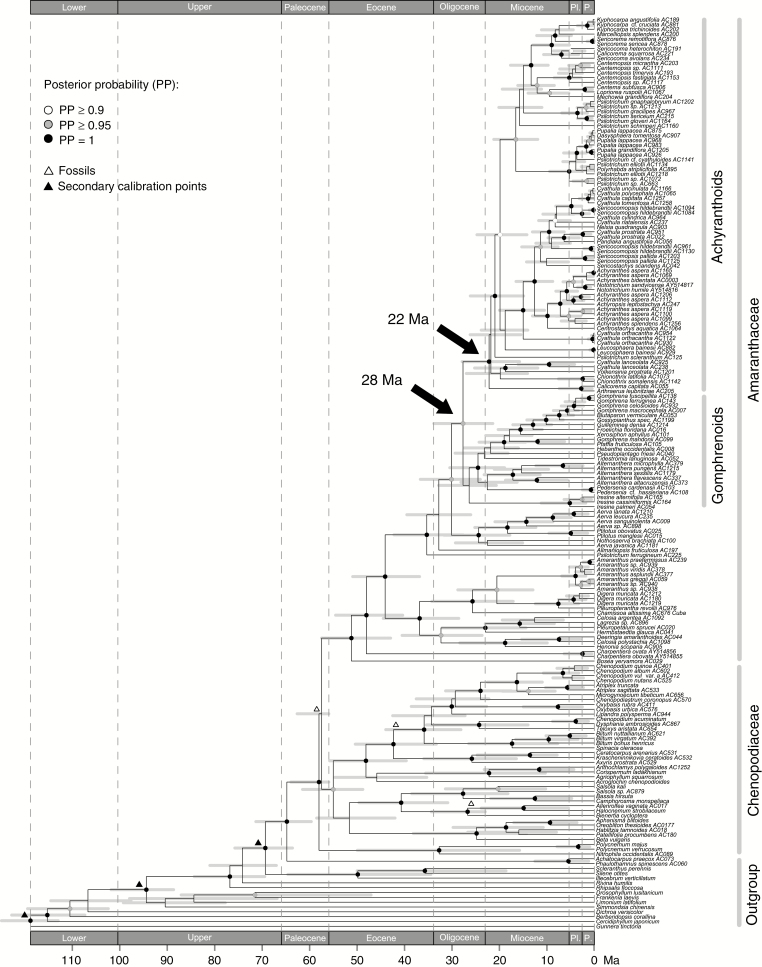
Fig. 3.
Chronogram of the Amaranthaceae–Chenopodiaceae alliance inferred from dataset C. Fossil (white triangles) and secondary (black triangles) calibration points as well as 95 % HPD intervals (grey bars) are visualized on the MCC tree. Epoch abbreviations: Lower, Lower Cretaceous; Upper, Upper Cretaceous; Pl., Pliocene; P., Pleistocene.

