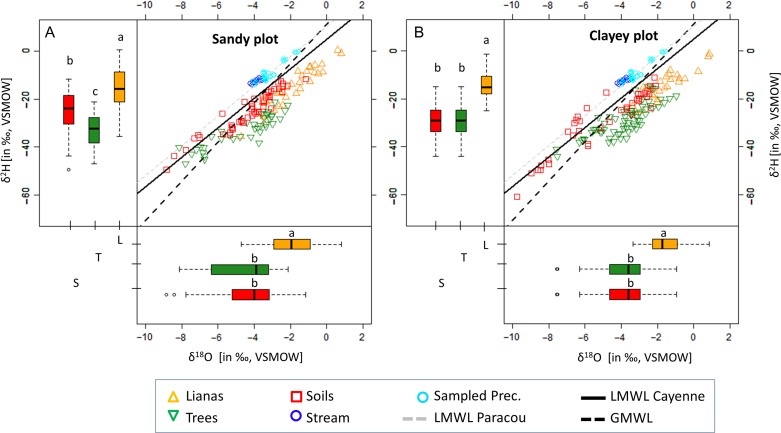
Figure 1.
Dual stable water isotope signatures (δ18O and δ2H; in ‰, VSMOW) for both the sandy plot (A) and the clayey plot (B). The stable water isotopic signature is shown for canopy lianas (xylem water; orange triangles), trees (xylem water; inverted green triangles), bulk soil water (red squares), precipitation (through-fall + bulk; cyan circles) and stream (blue circles) samples. The local meteoric water line (LMWL) of both Paracou (gray dotted line, δ2H = 6.209 δ18O + 10.176) and Cayenne (black solid line, δ2H = 6.148 δ18O + 4.951) are depicted, as well as the global meteoric water line (GMWL; black dotted line, δ2H = 8.2 δ18O + 11.3; Rozanski et al. 1993). Vertical and horizontal boxplots display the δ2H and δ18O signatures (in ‰, VSMOW), respectively, for canopy liana xylem water (L, orange), tree xylem water (T, green) and bulk soil water (S, red). Boxplots show Q25 − 1.5 IQR, Q25, Q50, Q75 and Q75 + 1.5 IQR values. Outliers are shown by open circles. Statistical differences are indicated by different letters (non-parametric Kruskal–Wallis test with Dunn post hoc analyses, P < 0.05).

