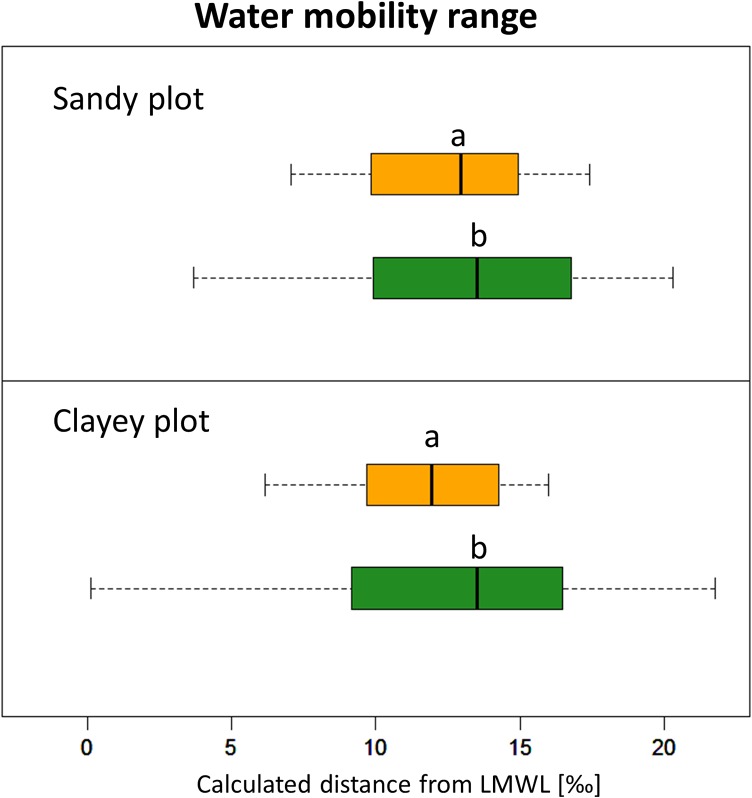
Figure 4.
Water mobility range, i.e., the distance to the LMWL (in ‰), for canopy lianas (orange) and trees (green) within the clayey and sandy plots. The median value represents the isotopic signature of the fractionated water taken up by both vegetation types, with higher values representing more fractionated and less mobile water. Significant differences in the median values are shown by different letters per plot (non-parametric Kruskal–Wallis with Dunn post hoc, P < 0.05). The specific ranges, the within vegetation variance, is a proxy of the ability of the vegetation type to retrieve water found in smaller soil pores, i.e., being less mobile. Variance ranges are significantly larger for trees in both plots (non-normal Fligner–Killeen test; clayey plot: median of χ2 = 4.7467, df = 1, P < 0.05; sandy plot: median of χ2 = 8.3386, df = 1, P < 0.01).

