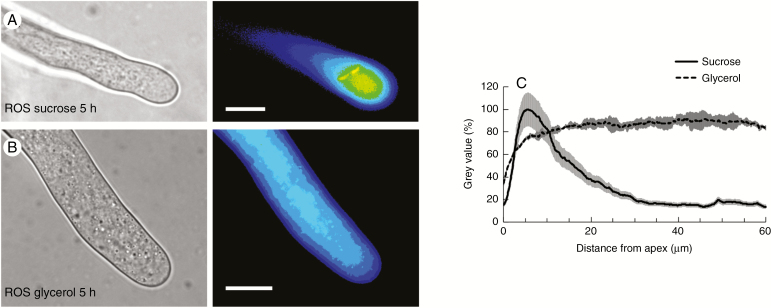
Fig. 5.
Analysis of the presence of ROS in pollen tubes after 5 h of growth in BK medium plus sucrose or glycerol. (A) A pollen tube (left) and the corresponding fluorescence signal of the ROS probe (pseudocoloured, right) after 5 h of growth in BKS. (B) A pollen tube (left) and the corresponding fluorescent signal of ROS (pseudocoloured, right) after 5 h of growth in BKG. (C) Distribution profile of ROS as measured from the apex of pollen tubes grown in BKS (solid line) and BKG (dashed line). The grey areas along the two profiles indicate the standard deviation.

