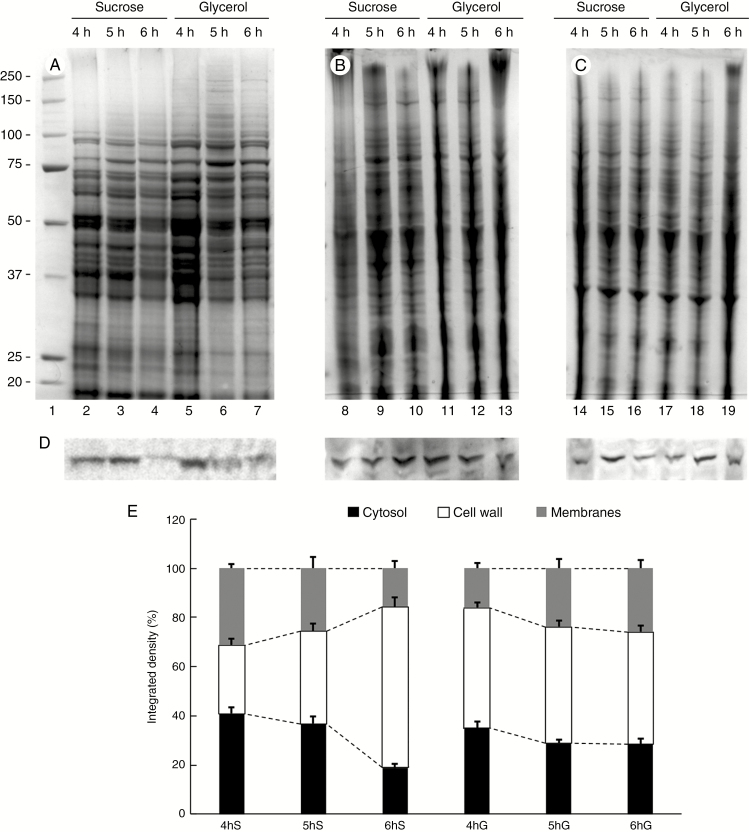
Fig. 7.
Relative accumulation of sucrose synthase in the cytosol, membranes and cell walls of pollen tubes grown in BKS and BKG. (A) Electrophoretic analysis of proteins extracted from the cytosol of pollen tubes grown for 4, 5 and 6 h in the two different media. Molecular weight standards (kDa) are indicated on the left. (B) Profile of proteins extracted from the cell wall of pollen tubes grown for 4, 5 and 6 h in BKS and BKG. (C) Electrophoresis of proteins extracted from the membrane fraction of pollen tubes grown under the same conditions. (D) Analysis by immunoblotting with antibody to sucrose synthase in the same protein samples described above: cytosol (left), cell wall (centre) and membrane fraction (right). (E) Relative quantification of signals after immunoblotting with antibodies to sucrose synthase in the three fractions described above: cytosol (black bars), cell wall (white bars) and membrane fraction (grey bars). S, sucrose; G, glycerol. Measurements are reported as percentages of total signals.

