Figure 1.
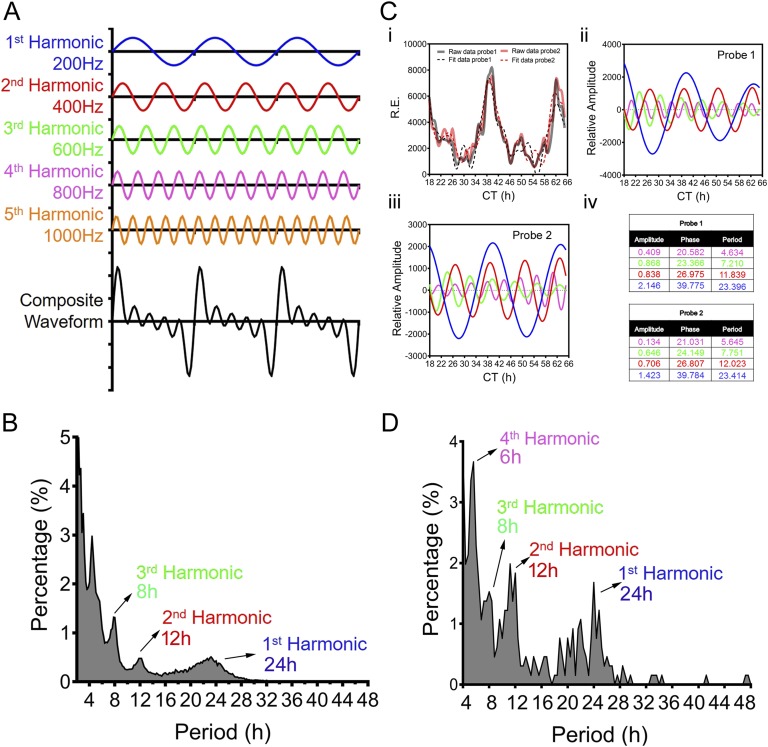
The concept of harmonics in physics and their biological counterpart. (A) Diagram showing the individual harmonics (200 Hz, 400 Hz, 600 Hz, 800 Hz, and 1000 Hz) as well as the composite waveform resulting from adding up all of the harmonics. (B) Distribution of periods of all oscillations identified from the hepatic gene expression microarray dataset [8] via the eigenvalue/pencil approach. The vast majority of oscillations cycle at the first (24-hour), second (12-hour), or third (8-hour) harmonic of the circadian rhythm (24 hours). (C) Representative deconvolution of Gck gene mRNA expression by the eigenvalue/pencil method. Gck expressions detected by two different probe sets are analyzed by the eigenvalue/pencil method. (i) Raw microarray data (solid line) and model fit (dashed line) for Gck hepatic expression as reported in Ref. [8]. Superimposed harmonic oscillations revealed by the eigenvalue/pencil method for probe 1 (ii) and probe 2 (iii) are shown. (iv) Amplitudes, phases, and periods of different oscillations for the two probes with the color matching the different oscillations depicted in (ii) and (iii). (D) Distribution of periods of all oscillations identified from the hepatic metabolites dataset [11] via the eigenvalue/pencil approach. The vast majority of oscillations cycle at the first (24-hour), second (12-hour), third (8-hour), or fourth (6-hour) harmonic of the circadian rhythm (24 hours).

