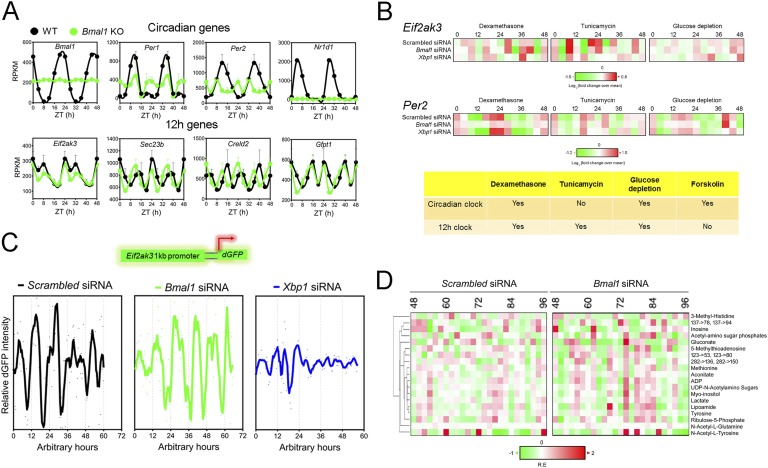
Figure 3.
Twelve-hour rhythms of gene expression and metabolism are cell-autonomous, established by a dedicated 12-hour clock and evolutionarily conserved. (A) Representative reads per kilobase of transcript per million mapped reads (RPKM) of normalized hepatic circadian (top) as well as 12-hour cycling (bottom) gene expression from wild-type (WT) and conventional BMAL1 knockout (KO) mice under 12-hour/12-hour light/dark conditions as reported in Ref. [86]. Data are graphed as the mean ± SEM (n = 4) and double plotted for better visualization. (B) Heat map representation of oscillations of Eif2ak3 and Per2 mRNA level after dexamethasone, tunicamycin, or glucose depletion shock treatment in MEFs. The heat map is derived from quantitative PCR data reported in Ref. [3]. A summary of the conclusion is shown in the table below. (C) Representative recordings of single-cell time lapse microscopy analysis of Eif2ak3 promoter-driven dGFP oscillation in scrambled siRNA, Bmal1 siRNA, or Xbp1 siRNA transfected MEFs. (D) Heat map of 12-hour cycling metabolites in dexamethasone-synchronized human U2OS cells under both scrambled siRNA and Bmal1 siRNA transfection conditions compiled from Ref. [11]. Twelve-hour cycling metabolites are identified by the eigenvalue/pencil method [3].

