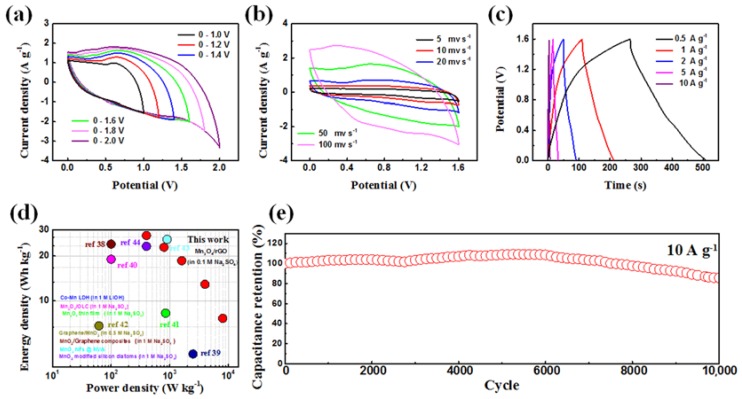
Figure 7.
Electrochemical performance of an ASC in 0.1 M Na2SO4 solution. (a) CV curves at the scan rate of 50 mV s−1 with different potential windows; (b) CV curves measured at different scan rates with the potential window of 1.6 V; (c) GCD curves at different current densities with the potential window of 1.6 V; (d) Ragone plots of the ASC compared with other work; (e) cycle performance measured over 10,000 cycles at 10 A g−1.

