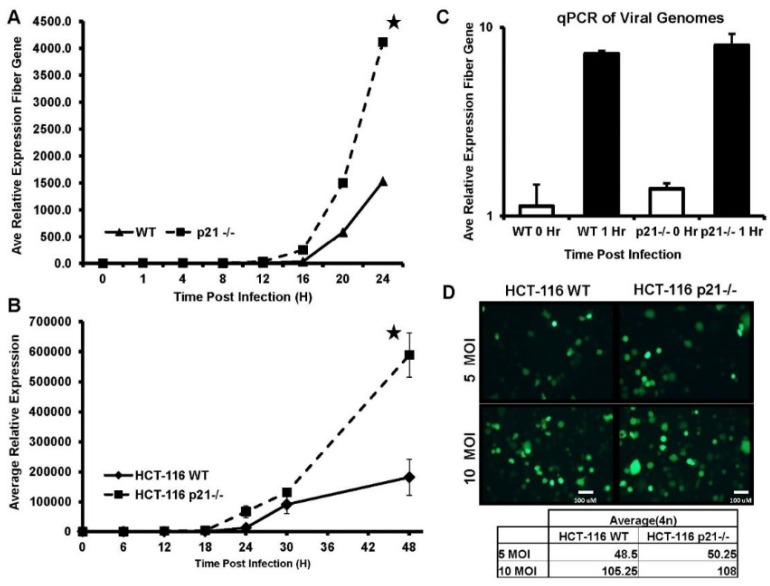
Figure 1.
HCT-116 WT (wildtype) and p21−/− cells were infected with 1 MOI (multiplicity of infection) of CN702 virus and infected cells were harvested for total DNA at indicated time points. Panel shows adenoviral DNA amplified by qPCR primers to fiber gene. Data normalized to β-Actin. Error bars S.E (A). HCT-116 WT and p21−/− Cells were infected with 1 MOI of CN702 virus and infected cells were harvested for total DNA at indicated time points. Panel shows adenoviral DNA amplified by qPCR primers to fiber gene. Data normalized to β-Actin. Error bars represent ± S.E (B). Adenovirus entry by viral DNA qPCR. HCT-116 WT and p21−/− cells were infected with 1 MOI of CN702 virus and infected cells were harvested for total DNA at indicated time points. Panel shows adenoviral DNA amplified by qPCR primers to fiber gene. Data normalized to β-Actin. Error bars S.E (C). HCT-116 WT and p21−/− cells were infected with 5 or 10 MOI of CN702. At 24 h p.i. wells were imaged for GFP (green fluorescence protein) and fields were counted for GFP infected cells. No statistical difference was found in WT-infected cells vs. p21−/− infected cells (D). Statistical significance was defined as * p value ≤ 0.05.

