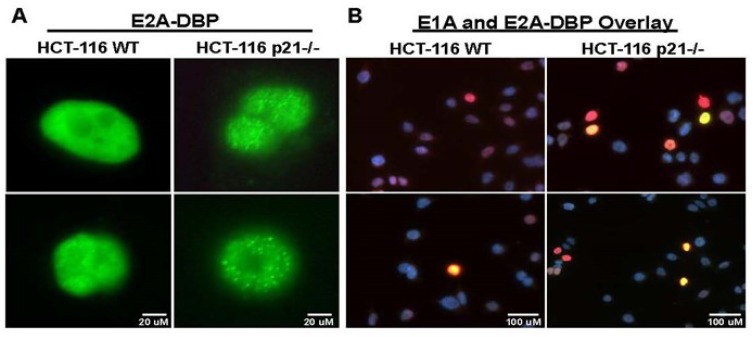
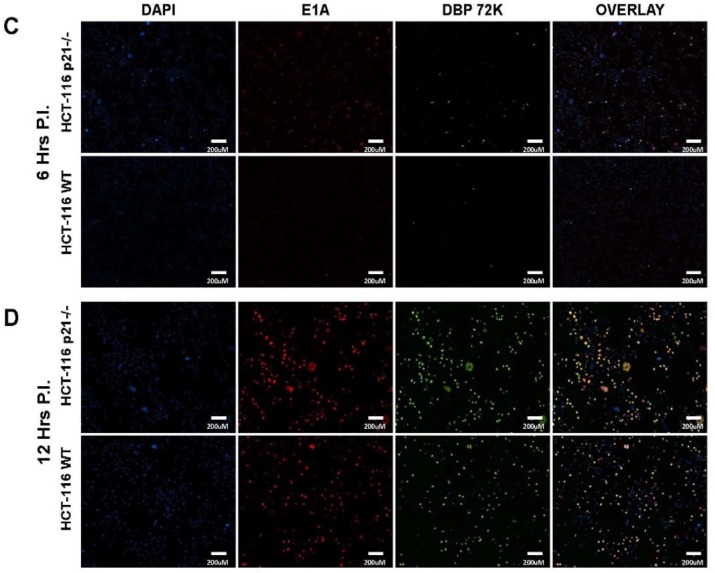
Figure 2.
DBP foci formation in infected cells. HCT-116 WT and p21−/− were plated in chamber slides and cells were infected with 5 MOI of CN702 virus. Infected cells were stopped at indicated time points and immunofluoresence microscopy was performed (A) 6 h p.i. 60× representatives of DBP IF at the same time point indicative of centers of viral DNA replication. 6 h p.i. 40× Field representatives of DBP (green) and E1A (red) IF at the same time point (B). Note in HCT-116 WT has approximately 3-fold lower number of cells that are both E1A and DBP positive for the same time point than HCT-116 p21−/− cells. 6 h p.i. DBP (green) and E1A (red) IF at the same time point. Note in HCT-116 WT fewer cells are both E1A and DBP positive than HCT-116 p21−/− cells (C). 12 h p.i. representative images. Note similar amount of dual stained cells shows no statistical significant difference in infectivity at later time point (p value > 0.05) (D).


