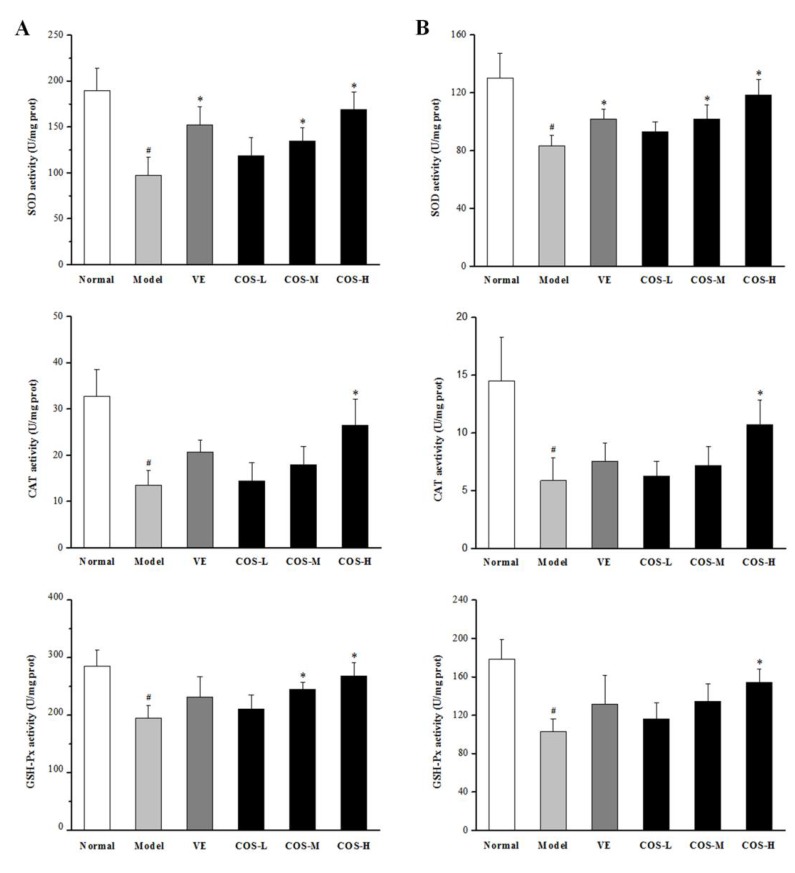
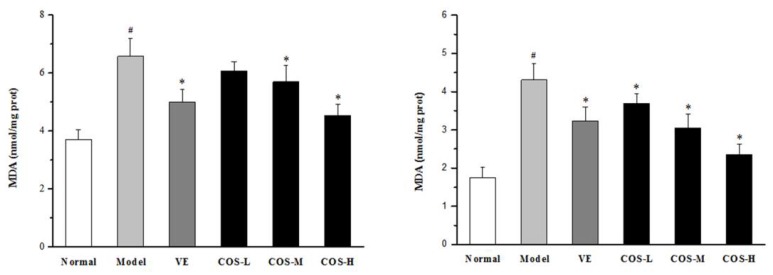
Figure 5.
Effect of COS on the activities of SOD, GSH-Px, and CAT, as well as MDA levels of mice liver (A) and kidney (B) caused by d-gal. Data represent means ± SD (n = 8). # p < 0.05 compared with the normal group; * p < 0.05 compared with the model group. Normal: normal control group; Model: d-gal-treated group; VE: d-gal plus VE treatment group; COS-L: d-gal plus COS (300 mg/kg/day) treatment group; COS-M: d-gal plus COS (600 mg/kg) treatment group; COS-H: d-gal plus COS (1200 mg/kg) treatment group.


