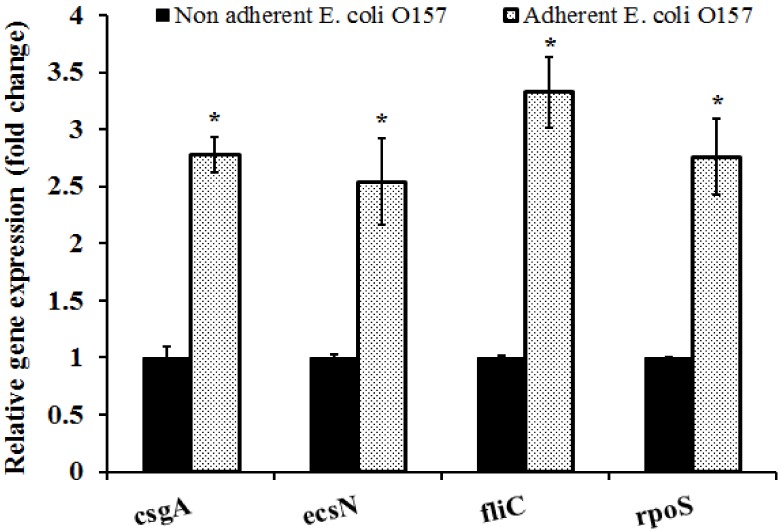
Figure 3.
Differences in the expression of adhesin and stress response genes as determined by RTqPCR. Gene expression was assayed using the StepOne Plus Real-Time PCR System. The data were normalized to the endogenous control (Gapdh) and the level of candidate gene expression between E. coli O157 cells in the inoculum and those retrieved from the nut surface was compared to study relative gene expression. * Expression of candidate genes in the adherent cells were significantly different from the non-adherent cells at p < 0.05.

