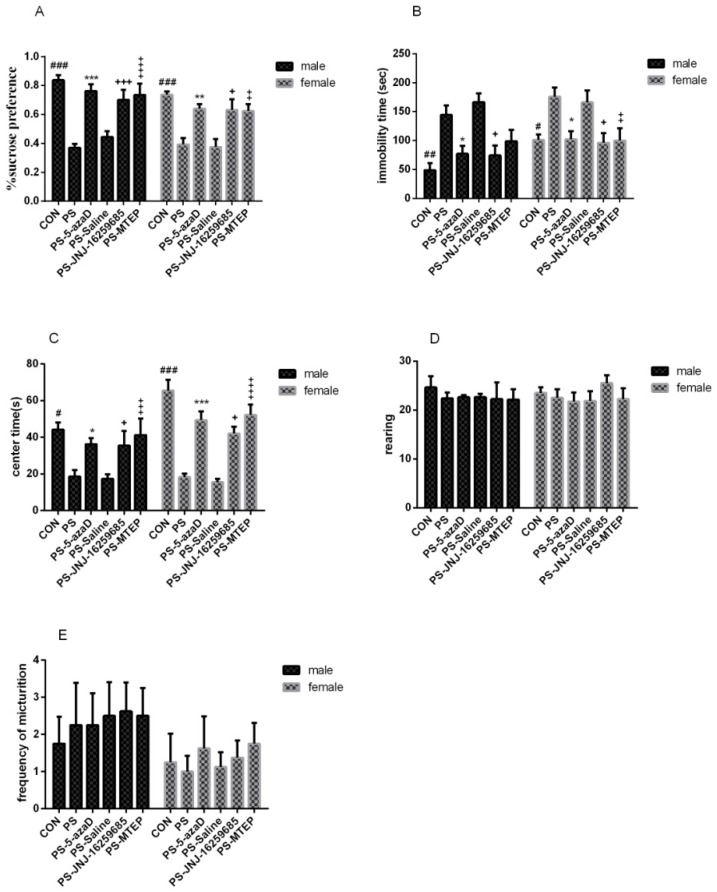
Figure 2.
The depression-like behavior test of OR. (A) Sucrose preference in PS induced OR; (B) Immobility time in PS induced OR; (C–E) Center time, rearing, and frequency of micturition shown in six groups (n = 8 each group). Data is expressed as mean ± SEM. ###
p < 0.001, ##
p < 0.01, #
p < 0.05 compare with CON and *** p < 0.001, ** p < 0.01, * p < 0.05 compare with PS. +++
p < 0.001, +
p < 0.05 compare with PS.  p < 0.001,
  p < 0. 05 compare with PS.

