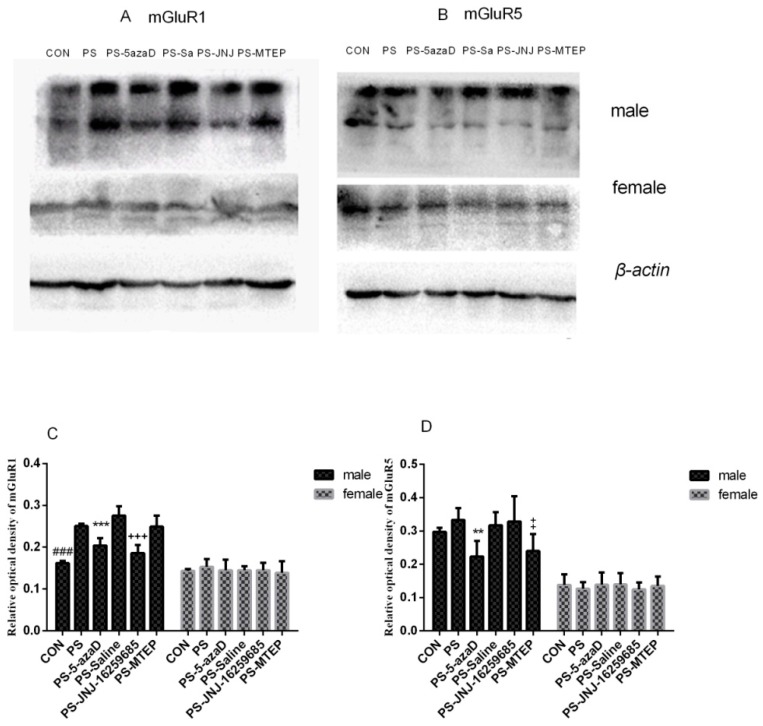
Figure 4.
Western Blotting (A) MGluR1 changes in OR hippocampus revealed by Western blot; (B) MGluR5 changes in OR hippocampus revealed by Western blot; (C,D) Western blotting analysis of mGluR1 and mGluR5 protein levels in the hippocampus shown in six groups (n = 6 each group). Data is expressed as mean ± SEM. ###
p < 0.001 compare with CON. *** p < 0.001, ** p < 0.01, +++
p < 0.001,  p < 0.05 compare with PS.

