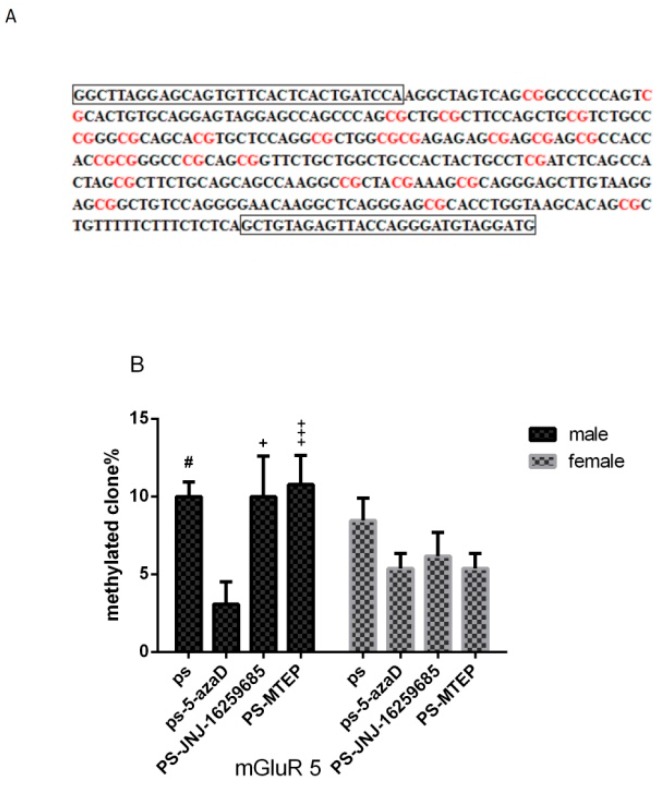
Figure 6.
DNA methylation analysis of the mGluR5 gene promoter. (A) The design of the primer position is surrounded by the black box; (B) Mean + SEM percentage of methylated clones in hippocampal samples from offspring shown in four groups (n = 5 each group). #
p < 0.05 compare with CON. +
p < 0.05,  p < 0.01 compare with PS.

