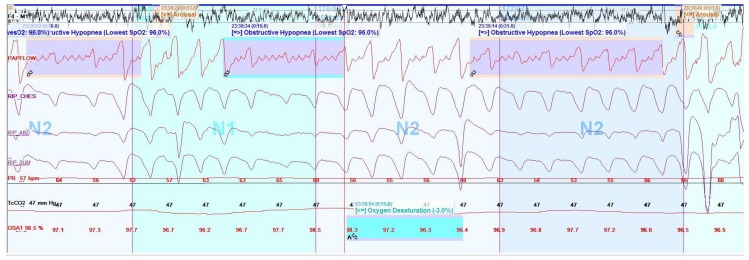
Figure 8.
Screen shot (2 min) of selected information derived from a polysomnogram montage demonstrating obstructive hypopneas (smaller deflections in flow signal are cardiac oscillations, not flow). F4-M1 represents electroencephalogram (EEG) signal; PAPFLOW represents flow signal from non-invasive positive pressure therapy sensor; RIP-CHES, RIP-ABD, and RIP-SUM represent inductance belt signals; Tc CO2 represents transcutaneous sensor reading; OSAT represents oxygen saturation reading.

