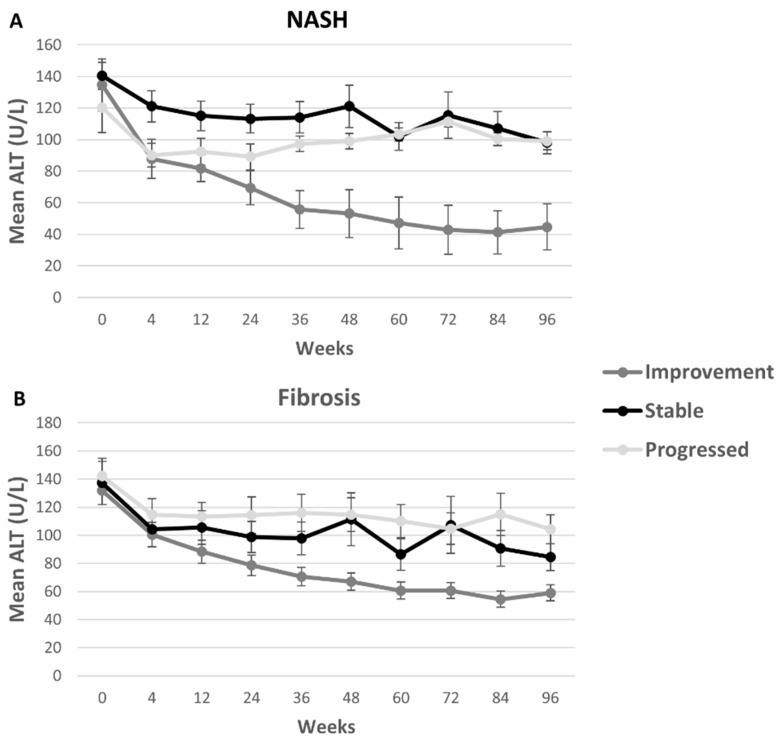
Figure 1.
Mean ALT concentrations were higher among stable and progressing groups than among improving participants, when measured by the NASH assessment. Mean ALT concentrations had similar initial trajectories when measured by the fibrosis score, with the improvement group dropping approximately 45%. Mean ALT is shown at each time point for participants that showed progression (lightest gray), improvement (dark gray) and that stayed stable from baseline to 96 weeks (black) for NASH assessments (A) and for fibrosis (B). ALT: alanine aminotransferase; NASH: nonalcoholic steatohepatitis.

