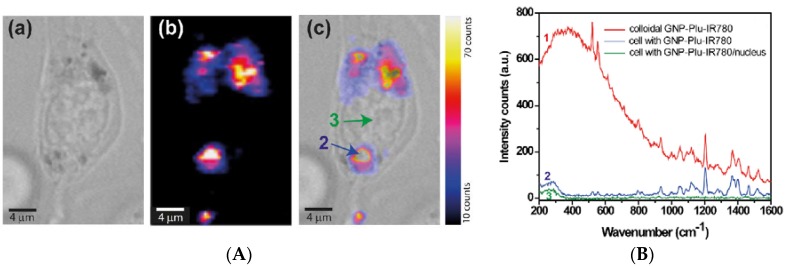
Figure 3.
(A) bright field image of a C-26 cell incubated with AuNP-Plu-IR780 (a), correspondent SERS map (b) and the overlapping (c) of the two previous images; (B) SERS spectra of colloidal solution of AuNP-Plu-IR780 (labelled as 1), and extracted spectra from regions marked blue arrow (2) in image (A(c)) and from nucleus as marked with the green arrow (3) in (A(c)). (Reproduced from [79] with permission).

