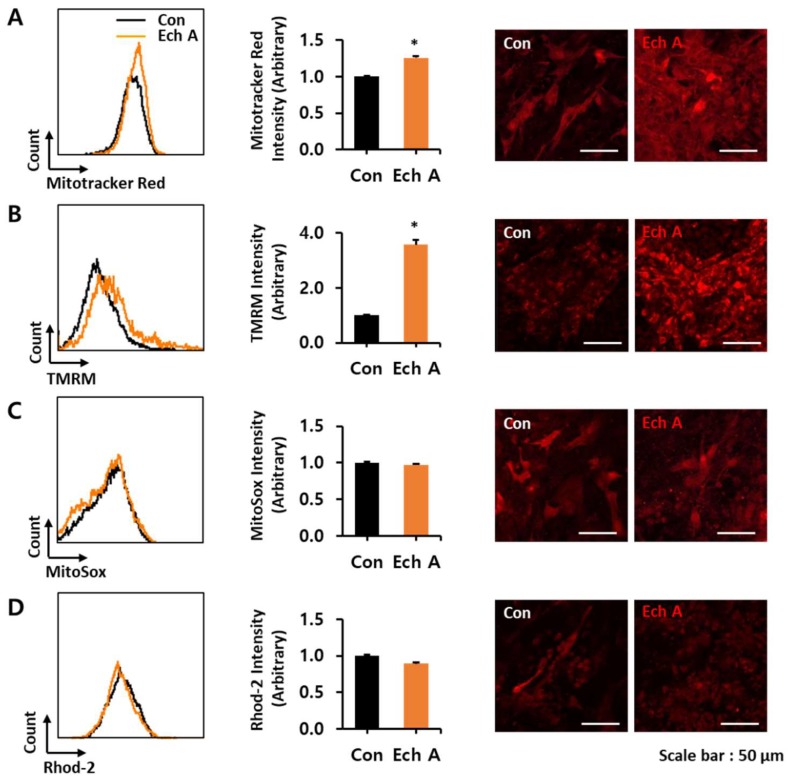
Figure 3.
Measurement of mitochondrial functions in differentiating embryoid bodies (EBs) after Ech A treatment. Representative FACS analyses of fluorescence intensities (left), the percentage of relative mean fluorescence intensities (middle), and matched confocal microscope live cell images (right, scale bars, 50 μm) of (A) Mitotracker™, (B) mitochondria membrane potential fluorescence probe, TMRM, (C) Mitosox™, and (D) Rhod-2, which were treated with the control vehicle (Con) or 50 µM of Ech A. Each group, n = 3. * p < 0.05 vs non-treated control vehicle.

