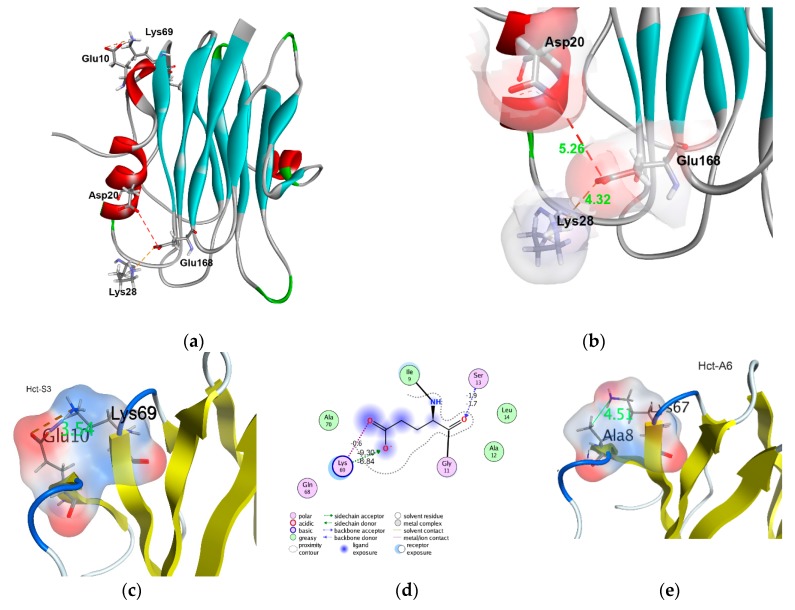
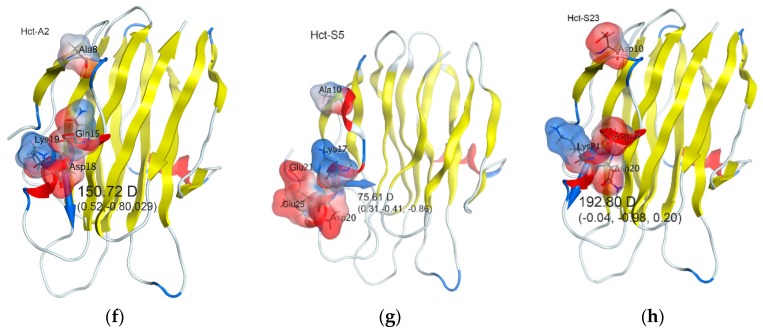
Figure 4.
Molecular models of Heteractis actinoporins. Ribbon diagrams of 3D-models in water-soluble state: (a) Hct-S3, (b) Hct-S3 Glu168 residue interactions, (c) Hct-S3 Glu10 residue interactions, (e) Ala8 and Lys67 interaction of Hct-A6, (f) Hct-A2, (g) Hct-S5, and (h) Hct-S23. (d) Two-dimensional (2D) schematic presentation of Hct-S3 Glu10 intramolecular interactions. The dipole moments of the N-terminal fragment (f–h) are indicated as blue arrow and labeled as value D (Debye) and direction (x, y, z). Variable residues are represented as sticks and labeled, the residue surfaces are colored by electrostatic potential, unfavorable electrostatic interaction is indicated as red dashed line, the salt bridges—as orange dashed lines, hydrogen bonds—as blue dashed lines, the distance both between carboxyl group of Glu10 side chain and Lys69 ε-amino group of Hct-S3 and Ala8 side chain methyl and Lys67 ε-amino group of Hct-A6 are labeled in green. The diagrams were produced using Discovery Studio Visualizer (a,b) [76] and MOE 2016.0802 (CCG) [77] (c–h) programs.


