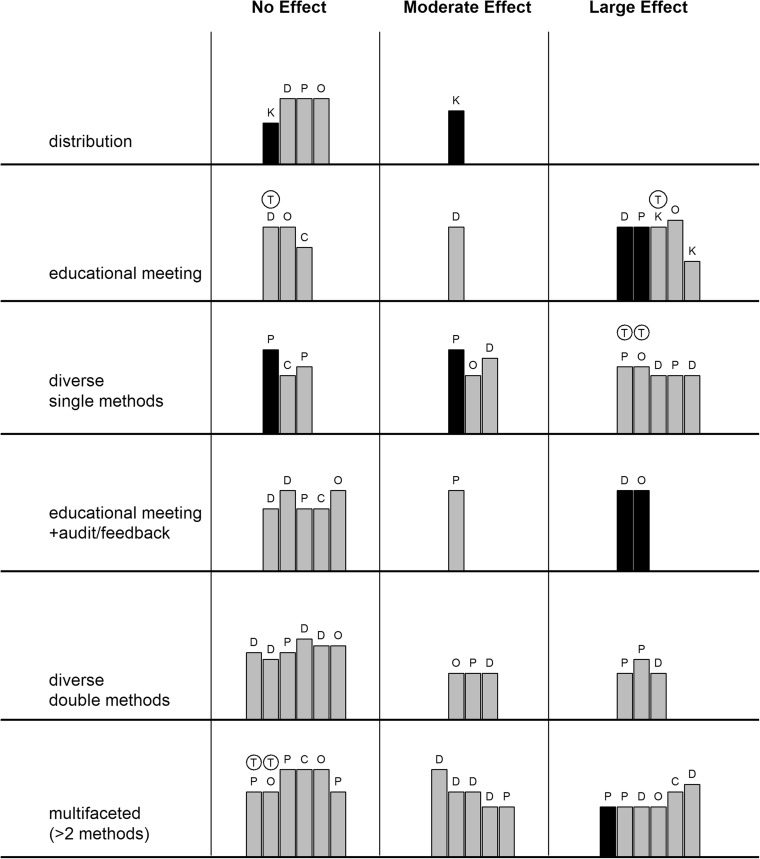
Figure 2.
Impact of intervention (harvest plot). Height of the bar: quality of the paper. Colour of the bar: number of PCPs in the intervention (grey < 100, black ≥ 100). Category of the outcome: D: diagnostic behaviour, P: prescription, C: counselling, K: knowledge level, O: outcome of care on patient level,
 : theory-based intervention.

