Figure 8.

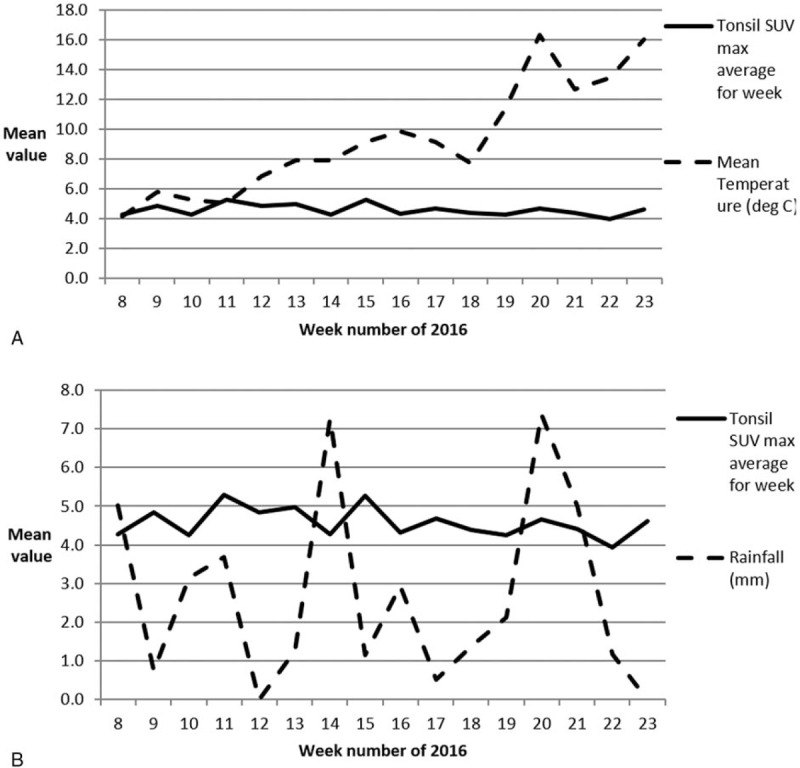
Weather parameters and tonsillar FDG uptake grouped on a weekly basis. (A) Displays average tonsillar SUVmax values for each of 16 weeks plotted against mean temperature throughout the study period. Whilst the temperature rises during the period from February to June there is no obvious change in tonsillar FDG uptake. (B) It shows rainfall averaged over a weekly basis of the 16-week study period. FDG = flurodeoxyglucose, SUVmax = maximum standardized uptake value.
