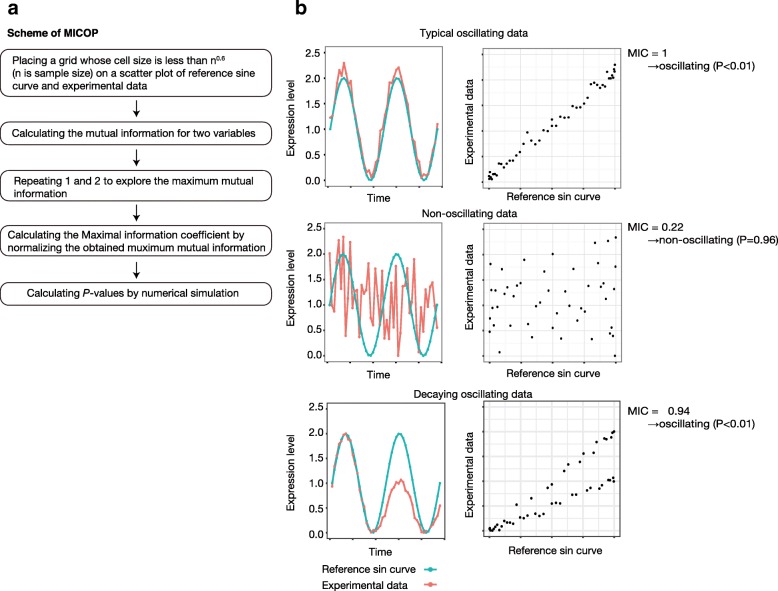
Fig. 1.
Concept of MICOP. A conceptual diagram of MICOP is shown. a Scheme of MICOP, b Typical results of MICOP. Left boxes: experimental data (red) and reference sin curves (blue); right boxes: scatter plots between reference sin curve (x-axis) and experimental data (y-axis); top: typical oscillating data (MIC = 0.1, P < 0.05); middle: nonoscillating data (MIC = 0.22, P > 0.05); bottom: decaying oscillating data (MIC = 0.94, P < 0.05)

