
Fig. 4.
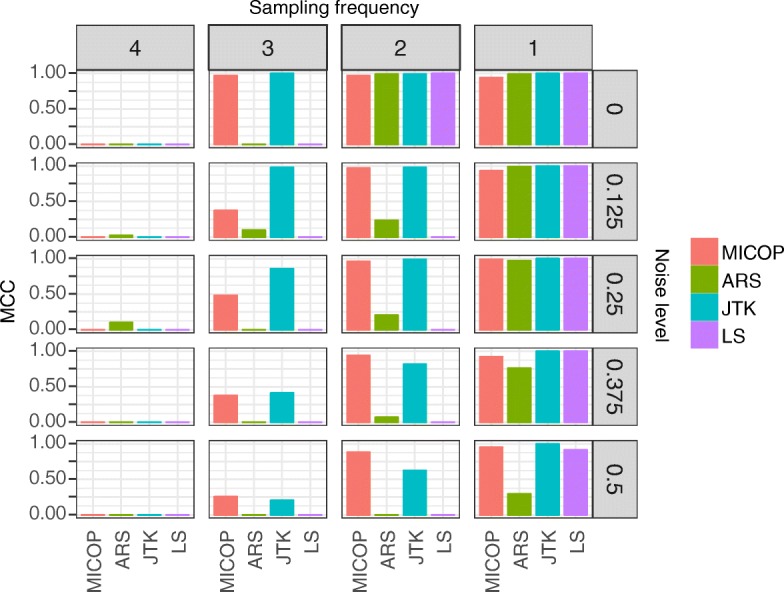
MCC values for time-series data with one-cycle data. Comparison of MCC values for each method with one-cycle time-series data. Row order indicates noise level and column order indicates sampling interval (h). Colors refer to each method. Sampling frequency and noise level were gradually adjusted