
Fig. 5.
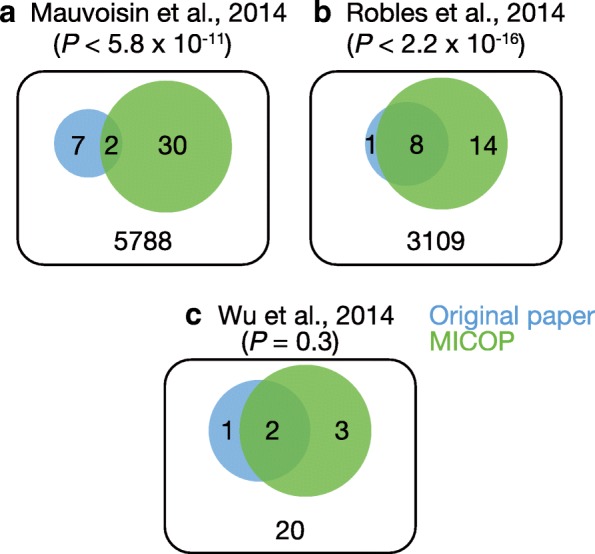
Venn diagrams of significant molecules the levels of which oscillate. Published time-resolved data sets were reanalyzed by MICOP, and Venn diagrams were constructed to quantify the overlap between MICOP and the original article. a and b represent mouse proteomics data: a C57BL/6 J [9], b C57BL/6 [8], and c Wu’s simulated data [23]. Blue indicates original article and green indicates MICOP. P-values were calculated by Chi-square tests to analyze overlap between MICOP and the original research article