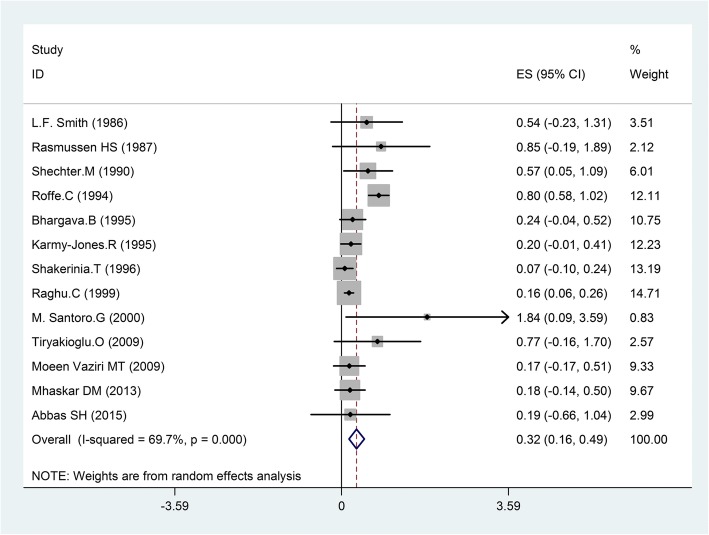
Fig. 2.
Forest plot and the rate of ventricular arrhythmias (left: magnesium, right: placebo).Square represents effect estimate of individual studies with their 95% confidence intervals with size of squares proportional to the weight assigned to the study in the meta-analysis. In this chart, studies are stored in order of the year of publication and author’s names, based on a random effects model

