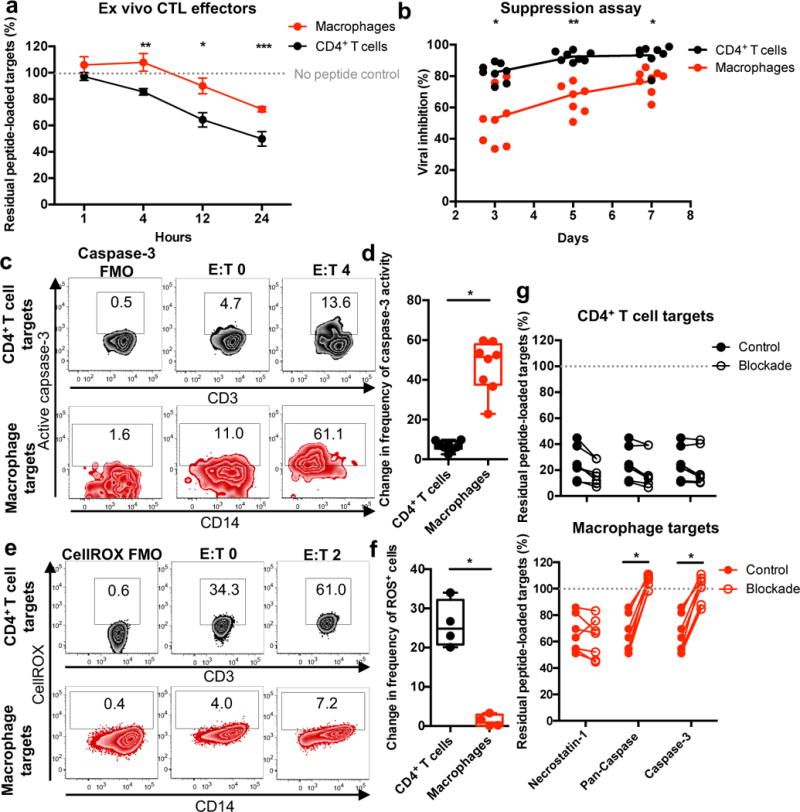
Fig. 2. CTL induce delayed, caspase-3 dependent apoptosis of macrophages resulting in less efficient control of HIV infection.

(a) Target killing time course. Peptide-loaded targets were incubated with ex vivo CTL from HIV+ donors (n=4 distinct samples from two independent experiments) for the indicated times, followed by analysis for live FarRed staining via flow cytometry. Shown are the means +/- SEM. Statistical analysis: two-sided unpaired t-test, *p=0.0201, **p=0.0165, ***p=0.0156. See also Supplementary Fig. 4. (b) Viral inhibition assay. Ex vivo CTL from HIV+ donors (n=8 distinct samples from three independent experiments) were co-cultured with HIV-infected CD4+ T cells or macrophages for seven days, followed by measurement of culture supernatant Gag-p24 antigen. Statistical analysis: two-sided unpaired t-test, * p=0.0005, **p<0.0001. (c) Caspase-3 activity was assessed in live target cells described in Fig. 1a. FMO: Fluorescence minus one (staining control). Shown is one representation of two independent experiments. (d) Caspase-3 activity in live targets. Summary of the absolute change in caspase-3 activity in live target cells for assays using expanded CTL from HIV+ patients (n=8 distinct samples from two independent experiments). Box elements, center line, limits and whiskers are the median, 25th-75th percentiles and min-max, respectively. Statistical analysis: two-sided unpaired t-test, *p<0.0001. (e) Detection of oxidative stress. Levels of reactive oxygen species (ROS) were measured in live target cells described in Fig. 1d. Shown is a representation of one of four samples from one experiment. (f) Detection of oxidative stress in live cells. Summary of the absolute change in frequency of ROS+ live target cells for assays using expanded CTL from HIV+ patients (n=4 distinct samples from one experiment). Box elements, center line, limits and whiskers are the median, 25th-75th percentiles and min-max, respectively. Statistical analysis: two-sided unpaired t-test, *p=0.0002. (g) Inhibiting target cell elimination. Peptide-loaded targets were pre-treated with inhibitors, followed by co-culture with expanded CTL for four hours and analyzed for live cell FarRed staining via flow cytometry. Shown are summaries from HIV+ patients (n=7 distinct samples from two independent experiments). Statistical analysis: two-sided paired t-test, *p<0.0001.
