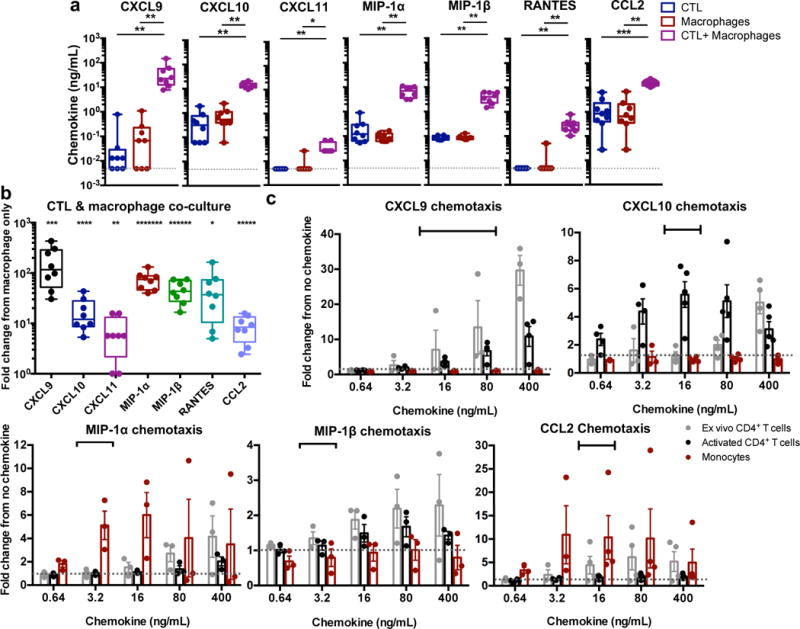
Fig. 7. CTL interaction with macrophages induces pro-inflammatory chemokine production from macrophages.

(a) Detection of pro-inflammatory chemokines. CTLs were co-cultured with peptide-loaded macrophages for 24 hours, followed by assessment of chemokines in the culture supernatant by cytokine bead array. The dotted gray line indicates the limit of detection for the assay. Shown are results from HIV+ patients (n=8 distinct samples from two independent experiments). Box elements, center line, limits and whiskers are the median, 25th-75th percentiles and min-max, respectively. Statistical analysis: two-sided Mann-Whitney test, *p=0.0011, **p=0.0002, ***p<0.0001. (b) Summary of the fold change response in chemokine production in the CTL + macrophage co-cultures versus the macrophage only cultures. Box elements, center line, limits and whiskers are the median, 25th-75th percentiles and min-max, respectively. Statistical analysis: two-sided one sample t-test, *p=0.0286, **p=0.0211, ***p=0.0118, ****p=0.009, *****p=0.0023, ******p=0.0006, *******p=0.0002. (c) Chemotaxis assays. Ex vivo CD4+ T cells, activated CD4+ T cells, and ex vivo monocytes were subjected to a transwell chemotaxis assay with titered CXCL9, CXCL10, MIP-1α, MIP-1β, and CCL2. Responses shown are the fold number of migrated cells from no chemokine conditions. Shown are results from three independent experiments (n=3 distinct samples for MIP-1α and MIP-1β) and four independent experiments (n=4 distinct samples for CXCL9, CXCL10 and CCL2), with means +/- SEM. Black bars indicate the range of chemokine observed in co-culture conditions as described in Table 1. See also Supplementary Fig. 7.
