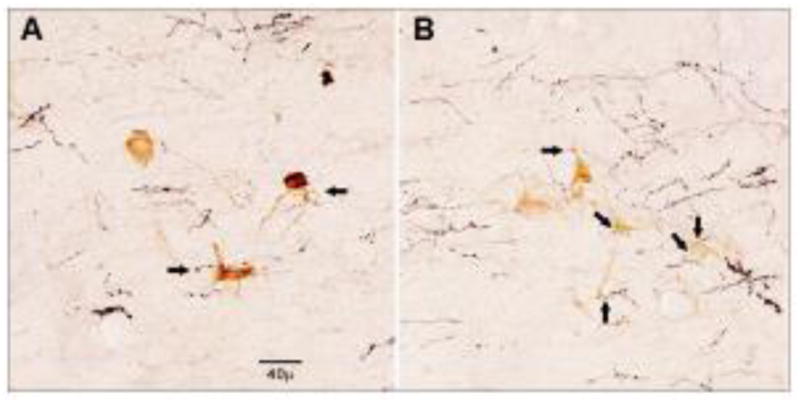
Figure 3.

High powered (40X) magnification of neuron profiles in the A7 area immunoreactive for TH in the same plane of view as axons labeled with BDA. Arrows indicate putative synaptic connections for both dendrites and cell bodies. Scale bar = 40μ. This photomicrograph is from the A7 area in Figure 2A.
