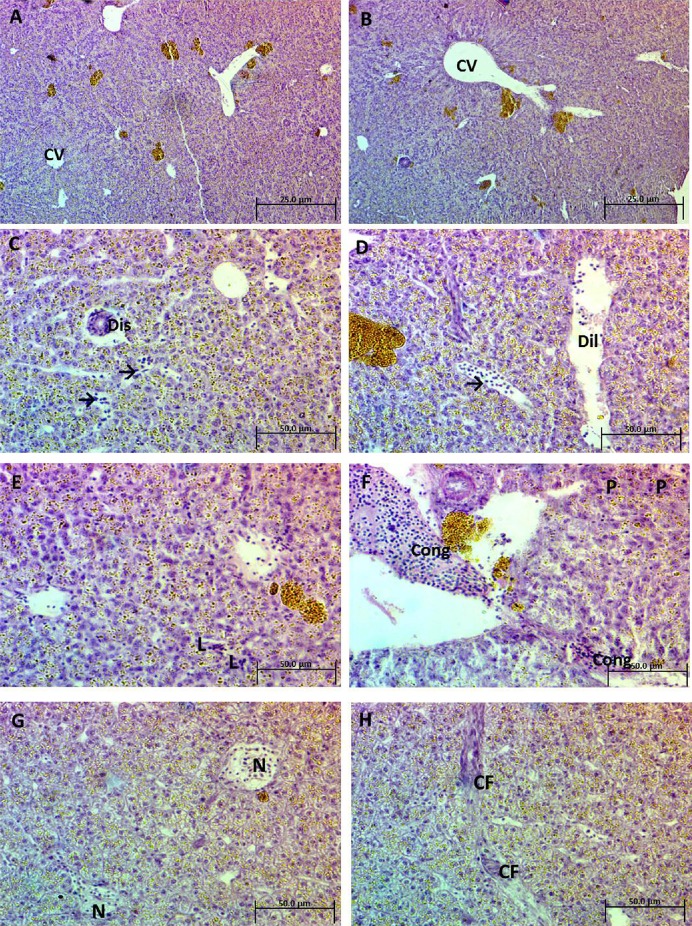
Fig. 4.
(A and B) Photomicrograph of a liver section of control Clarias gariepinus showing normal architecture of hepatic tissue and the central vein (CV) (H&E, 200×). (C and D) Photomicrograph of liver sections of treated C. gariepinus after exposure to 25 mg/L Ag-NPs showing different features of morphological changes such as dislocation of epithelium (Dis) and dilatation of blood vessels (Dil), associated with inflammatory leukocytic infiltration (arrows) (H&E, 400×). (E and F) Photomicrograph of liver sections of treated C. gariepinus after exposure to 50 mg/L Ag-NPs showing mild inflammatory leukocytic infiltration (L), pyknotic nuclei of hepatocytes (P), and congestion (Cong) (H&E, 400×). (G and H) Photomicrograph of liver sections of treated C. gariepinus after exposure to 75 mg/L Ag-NPs showing necrotic areas (N) and noticeable connective tissue fibers (CF). (H&E, 400×). Ag-NP = silver nanoparticle; H&E = hematoxylin and eosin.

