
Figure 3.
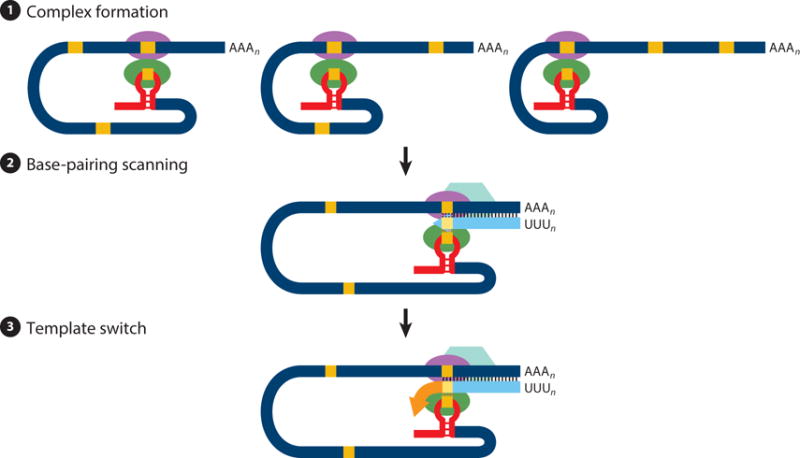
Three-step model of coronavirus transcription. (❶) Complex formation. Proteins binding transcription-regulating sequences are represented by ellipsoids, the leader sequence is indicated with a red bar, and core sequences are indicated with orange boxes. (❷) Base-pairing scanning. Negative-strand RNA is shown in light blue; the transcription complex is represented by a hexagon. Vertical lines indicate complementarity between the genomic RNA and the nascent negative strand. (❸) Template switch. Due to the complementarity between the newly synthesized negative-strand RNA and the transcription-regulating sequence of the leader, template switch to the leader is made by the transcription complex to complete the copy of the leader sequence.