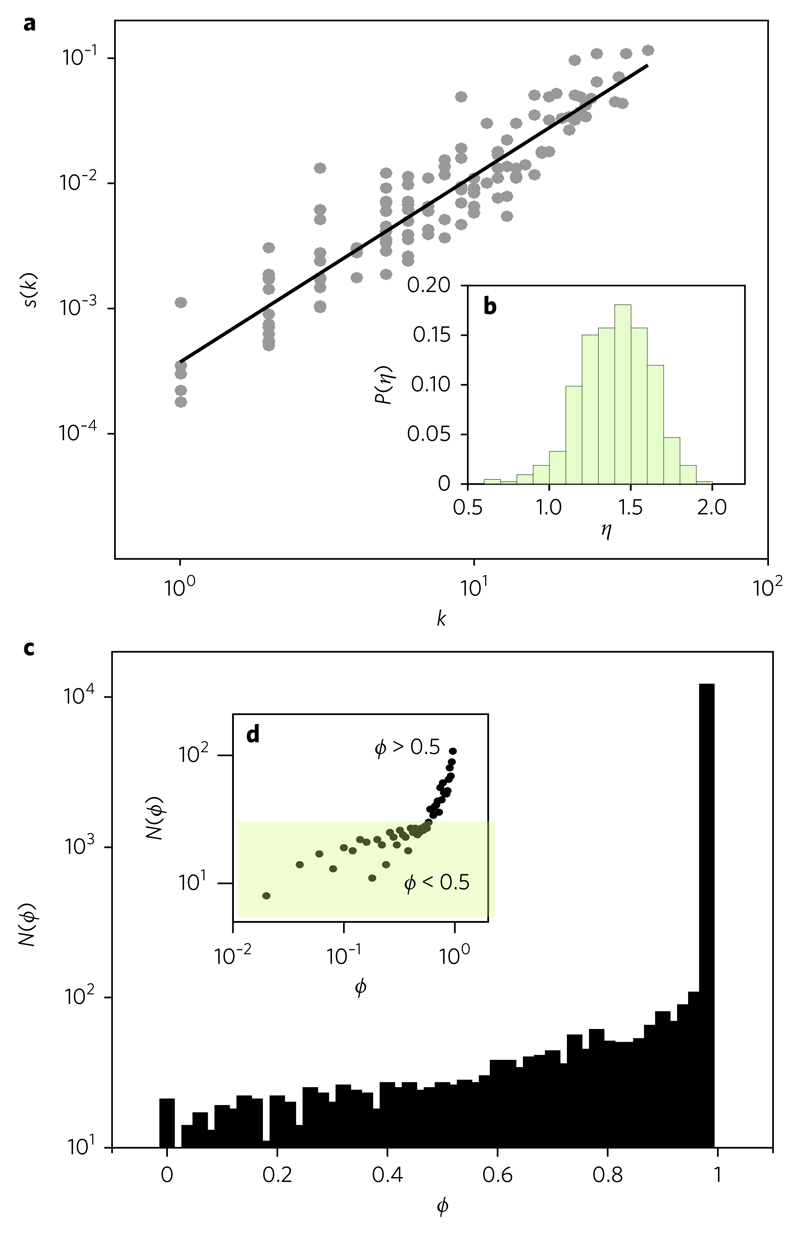
Fig. 3. Higher-order correlations and network asymmetries.
a, Scaling behaviour displayed by the strength–degree distribution for a single system. The adjusted exponent for this particular system gives η = 1.49. b, Distribution of exponents, P(η), for a subsample of 426 connected graphs with sizes S > 100. The average value for this distribution gives 〈η〉 = 1.50, which is consistent with the available data42. c, Frequency distribution of asymmetry values ϕ(i,j) between the two possible directed weights connecting a pair (i,j) of species. If we indicate these two values as ωij and ωji, the asymmetry of this pair is defined as The frequency of pairs gives an asymmetric distribution that is strongly skewed towards higher ϕ values. d, This asymmetry is also displayed in a log–log scale, markedly growing for ϕ > 0.5 values, as found in real webs8.

