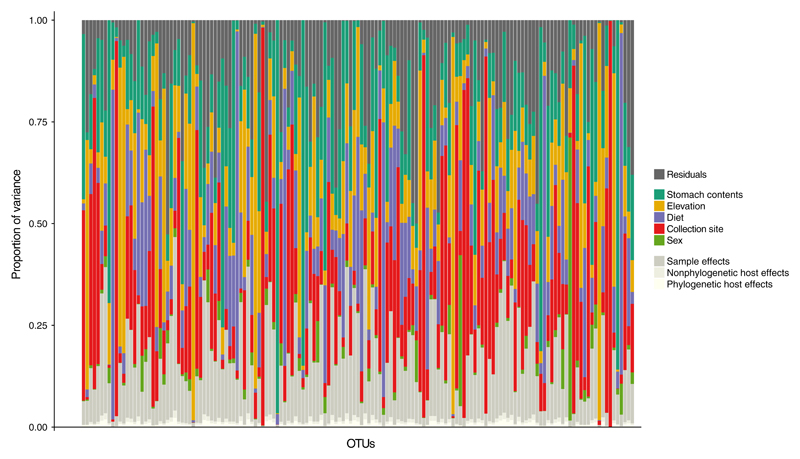
Figure 5.
The y-axis shows the relative proportion of variance in species occurrences explained by the hierarchy present on αi, the covariates included on the linear predictor Lij, and the residual variance not accounted for by the modelled effects, that is, the diagonal elements of the residual covariance matrix Ω, for each OTU (x-axis) [Colour figure can be viewed at wileyonlinelibrary.com]

