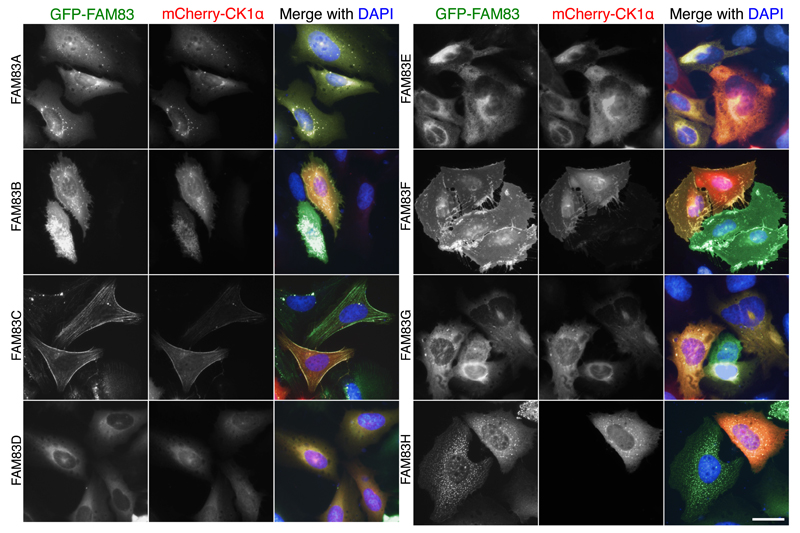
Fig. 4. FAM83 proteins and CK1α colocalize in cells.
U2OS cells stably integrated with Tet-inducible expression of GFP-FAM83A–H were transfected with mCherry-CK1α. Cells were processed for fluorescence microscopy following 24h of doxycycline treatment. DNA was stained with DAPI. Images from one field of view representative of 3 independent experiments are shown. The number of cells that displayed staining patterns identical to the representative image were documented for each experiment: GFP-FAM83A (n=50); GFP-FAM83B (n=31); GFP-FAM83C (n=37); GFP-FAM83D (n=32); GFP-FAM83E (n=55); GFP-FAM83F (n=44); GFP-FAM83G (n=43); GFP-FAM83H (n=32). Fluorescence images for GFP-alone and mCherry-CK1α alone expressing cells are included in fig. S6. Scale bar, 20 µM.

