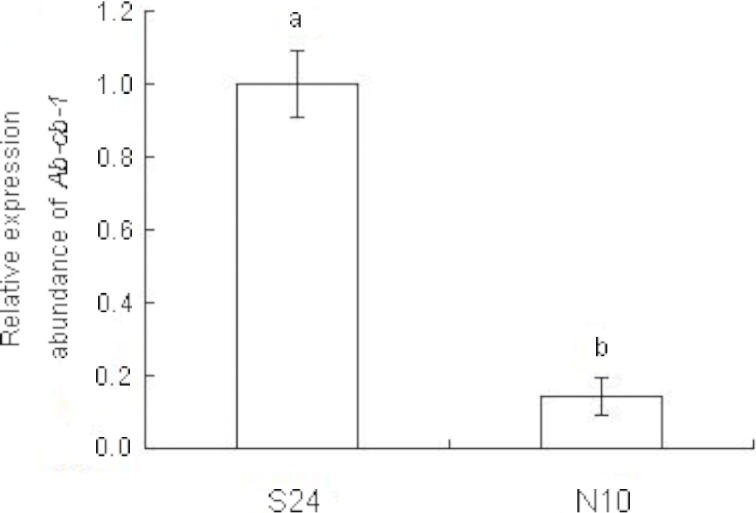
Fig 4. Expression levels of Ab-cb-1 in two populations of Aphelenchoides besseyi.

S24, N10: populations of A. besseyi collected from Fragaria ananassa and Oryza sativa, respectively; bars indicate standard errors of the mean (n = 3), and different letters indicate significant differences (p<0.05) between treatments.
