
Fig. 1. S100B binds to Aβ42.
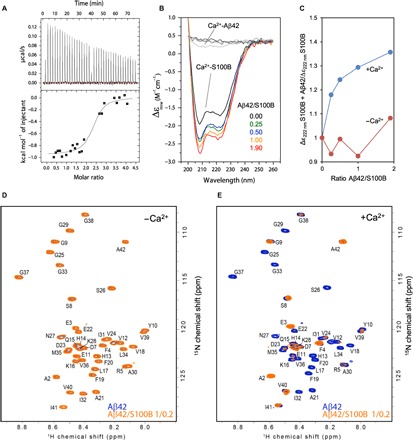
(A) Isothermal titration calorimetry analysis of S100B binding to Aβ42 in the presence of calcium. The upper panel shows the raw heats of binding, and the lower panel shows the integrated data obtained after subtracting the heat of dilution from the buffer. Data fitting was performed with the nonlinear regression analyses of one binding site model obtaining the thermodynamic parameters N = 2.37 ± 0.07, Kd = 0.59 ± 0.23 μM, ΔH = −947.1 ± 29.48 cal mol−1, and ΔS = 25.3 cal mol−1 deg−1. (B) Far UV-CD spectra of 4 μM Ca2+-S100B alone (black) and with a molar ratio Aβ42/S100B of 0.25 (green), 0.5 (blue), 1 (orange), and 1.9 (red) after incubation overnight at 4°C. (C) Ratio of ellipticity at 222 nm of S100B alone and S100B + Aβ42 in the presence (blue) and absence (red) of 1.1 mM CaCl2. (D) Heteronuclear single-quantum coherence (HSQC) spectra of 100 μM 15N-labeled Aβ42 in the absence (blue) and in the presence (orange) of 20 μM S100B. (E) HSQC spectra of 100 μM 15N-Aβ42 in the absence (blue) and in the presence (orange) of 20 μM S100B with 10 mM CaCl2. ppm, parts per million.