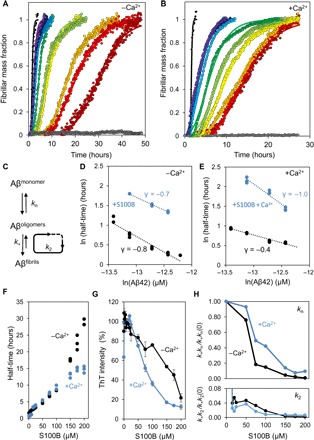
Fig. 3. S100B modulates Aβ42 aggregation.

(A) Fibril formation of 5 μM Aβ42 (black) in 50 mM Hepes (pH 7.4) at 37°C under quiescent conditions in the presence of 10 μM (purple), 15 μM (dark blue), 20 μM (blue), 25 μM (light blue), 50 μM (dark green), 75 μM (light green), 100 μM (yellow), 150 μM (orange), 175 μM (red), and 200 μM (dark red) S100B. S100B (200 μM) alone, as control, is represented in gray. Plots represent averaged normalized intensity curves obtained from three independent replicates for each of the tested conditions. (B) Fibril formation of 10 μM Aβ42 (black) with 1.1 mM CaCl2 in 50 mM Hepes (pH 7.4) at 37°C under quiescent conditions in the presence of 10 μM (purple), 15 μM (dark blue), 20 μM (blue), 25 μM (light blue), 50 μM (dark green), 75 μM (light green), 100 μM (yellow), 150 μM (orange), 175 μM (red), and 200 μM (dark red) S100B. S100B (200 μM) alone, as control, is represented in gray. Plots represent averaged normalized intensity curves obtained from three independent replicates for each of the tested conditions. (C) Representative scheme of microscopic events occurring during Aβ42 aggregation: primary nucleation (kn) starting from monomers, elongation (k+) by monomer addiction to existing aggregates, and secondary nucleation (k2) from addition of monomers to fibril surface. (D) Log-log plot of the half-time of the Aβ42 aggregation reaction as a function of the initial Aβ42 monomer concentration in the absence (black) or in the presence (blue) of 15-fold excess of S100B. (E) Log-log plot of the half-time of the Aβ42 aggregation reaction as a function of the initial Aβ42 monomer concentration with 1.1 mM CaCl2 in the absence (black) or presence (blue) of 15-fold excess of S100B. (F) Half-times as function of increasing concentrations of S100B in the presence of Aβ42 with (blue) and without (black) 1.1 mM CaCl2. Dots represent values obtained from three independent replicates for each of the tested conditions. (G) Plot of ThT intensity of the end point of the aggregation kinetics in the presence of Aβ42 with increasing concentrations of S100B in the absence (black) and in the presence (blue) of 1.1 mM CaCl2. Dots represent averaged values obtained from three independent replicates for each of the tested conditions. (H) Plot of S100B-dependent change in microscopic rates of Aβ42 aggregation. The top panel represents the ratio of combination of kinetic rates describing primary nucleation (k+kn) with and without S100B in the absence (black) and in the presence (blue) of 1.1 mM CaCl2. The bottom panel represents the ratio of combination of kinetic rates describing secondary nucleation (k+k2) with and without S100B in the absence (black) and in the presence (blue) of 1.1 mM CaCl2. Microscopic rates were determined by individual fitting with the secondary nucleation model and with combined rate constants k+kn and k+k2 as free fitting parameters. Plots represent averaged values obtained from three independent replicates for each of the tested conditions.
