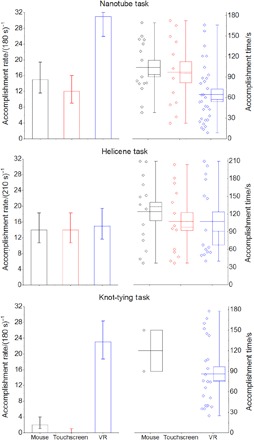
Fig. 3. User study results.

Left-hand panel shows user accomplishment rates for the tasks outlined in Fig. 2 (n = 32 for all tasks), with Poisson error estimates. Right-hand panel shows the corresponding distribution of task accomplishment times, along with box-and-whisker plots. Whiskers indicate the data range, and box limits indicate the standard error of the distribution. The mean is shown as a solid line, and the median is shown as a dashed line.
