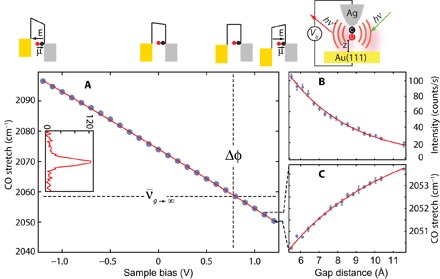
Fig. 1. Calibration of the molecular electrometer.

(A) Bias dependence with a gap fixed at 5.5 Å (set at 0.1 nA, +1.2 V). The inset shows the CO line spectrum. (B) Gap dependence of Raman intensity and (C) C–O stretching frequency. All data are recorded with an excitation at λ = 634 nm and an incident intensity of ~5 μW/μm2.
