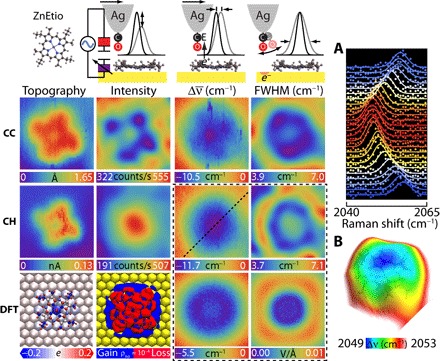
Fig. 2. ZnEtio on Au(111): Imaging principles of TERS-mfm are illustrated in the header.

Simultaneously recorded STM topography and TERS-relayed images of intensity, frequency shift (), and linewidth recorded under CC and CH scan mode. We low pass–filtered the intensity and linewidth maps for clarity. The maps in CC and CH mode are referenced to 2058.6 and 2059.5 cm−1, respectively. The DFT results consist of the Löwdin projected atomic charges, deformation charge density, and vertical and lateral electric fields. (A) Stark tuning of the CO vibration along the dashed line in the CH map. (B) Electrostatic field surface obtained by color-coding the Stark shift on the STM CH topography. The common image size is 23 Å × 23 Å. The set point is 0.1 nA, 1.2 V.
