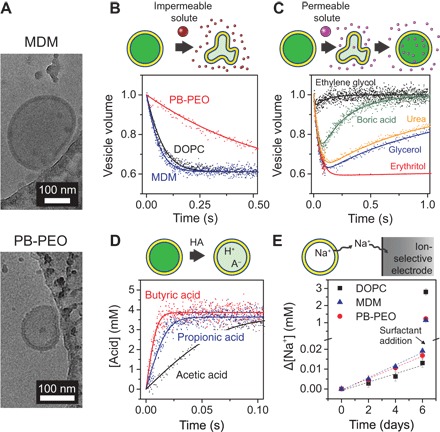
Fig. 2. Permeability measurements using lipid and BCP vesicles.

(A) Cryo-EM images of MDM and PB-PEO LUVs prepared by extrusion through 200-nm pores. The vesicles are located near the edge of a carbon-coated copper microscopy grid. Small, irregular structures are artifacts of the ice structure and the carbon coating. From these and more images (fig. S1), the nonpolar core thicknesses of the MDM and PB-PEO bilayers were estimated to be 15 ± 2 and 13 ± 2 nm, respectively. (B) Water and (C) solute permeability measurements using osmolarity differences. Normalized LUV volume was determined via the self-quenching of encapsulated fluorophore upon exposure at 25°C to osmotic gradients induced by (B) relatively impermeable NaCl and (C) relatively permeable solutes. The data are averaged from 3 to 10 time traces and fitted (solid curves) using Eqs. 1 and 2 to determine water and solute permeabilities. LUV volumes change because of water transport that balances the osmotic pressures inside and outside of the vesicles. Solute permeability measurements in (C) are shown for MDM. (D) Acid influx measurements for DOPC at 6.4°C, showing intravesicular acid concentration based on decreased intravesicular pH and the pH sensitivity of encapsulated fluorophore. Data are averaged from 6 to 10 time traces and fitted (solid curves) using Eq. 5 to determine acid permeability. (E) Sodium efflux from LUVs at 25°C, shown as the cumulative change in extravesicular sodium concentration, as determined using a sodium-selective electrode (n = 3). Dashed lines are linear fits used in Eq. 6 to determine the sodium permeability. After 6 days, a surfactant (Triton X-100) was added to solubilize the vesicles and determine the total vesicle volume.
