. 2018 Jun 29;7:e33506. doi: 10.7554/eLife.33506

Figure 3. NFRe promotes nodule organogenesis in Lotus japonicus.

(A) Greenhouse-grown nfre plants formed fewer root nodules compared to WT when analysed at eight wpi with M. loti. (B) Agar plate-grown nfre plants form fewer primordia than WT at 5 wpi with M. loti. (C) The nfre mutants and wild type plants form similar number of short and long root hair infection threads at 9 and 14 dpi. (D) Representative nuclear calcium oscillations (spiking) induced by R7A Nod factor (10–8 M) in wild type and nfre mutant root hairs. Ca2+ oscillations are presented as ratiometric values between YFP and CFP signals detected on the basis of the NLS-YC3.6 Ca2+sensor. (E) The inter-spike interval of nfre-1 mutant is significantly longer than that of WT. (F) Venn diagrams of Nod factor up- and down-regulated (parentheses) genes detected in the susceptible zone at 24 hr after treatment. The values given at the bottom of columns in (A) and (C) represents the number of plants analysed. Error bars represent standard error of the mean. *p<0.05 and **p<0.01, Student´s t-test compared to wild type.

Figure 3.

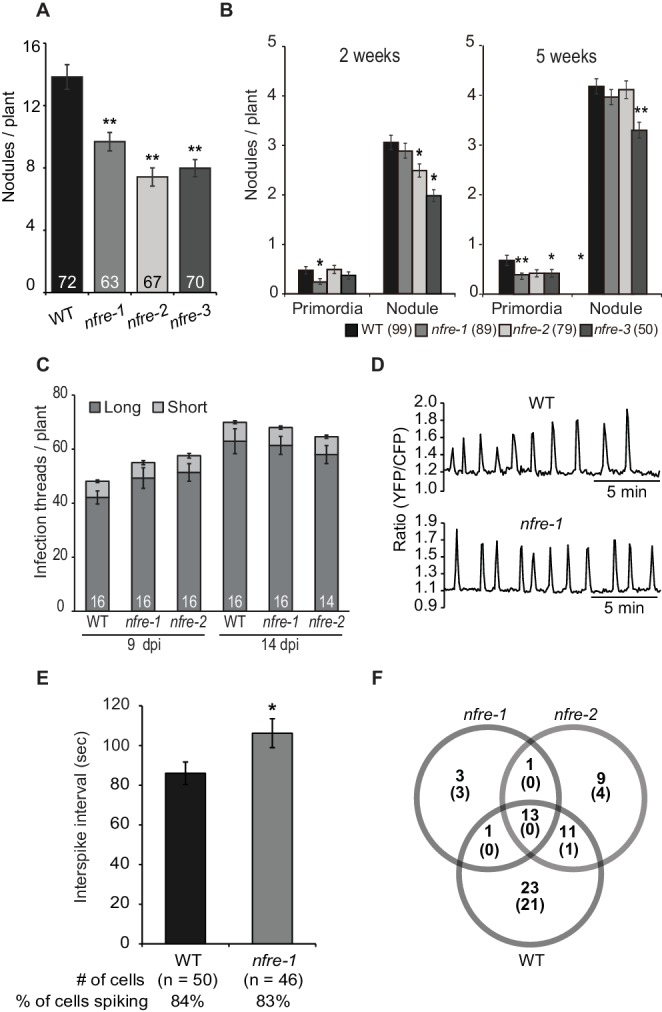
Figure 3—figure supplement 1. The phenotype of wild-type and nfre plants.

Figure 3—figure supplement 1.

(A) Nfre rescues the nfre-1 nodulation phenotype. Nodules formed by Gifu wild type or nfre-1 plants at 7wpi with M. loti NZP2235 transformed with the empty vector or the wild type Nfre driven by the CaMV 35S promoter respectively. The number of plants analysed is shown (n). Error bars-standard error of the mean. **p<0.01, Student´s t-test. (B) Wild-type and nfre plants after 9 weeks growth on soil. Wild-type plants are larger, have more shoots (arrows), flowers and pods (arrowheads), while nfre plants are shorter, and have just started to develop flowers. (C) Shoot fresh weight (D) Total number of nodules formed when exposed to the native soil rhizobia. (E) The ratio of pink nodules formed when exposed to the native soil rhizobia. The number of plants analysed is shown at the bottom of each bar. Box plot graphs are shown with max and min values, and the significance was assessed by Kruskal-Wallis test. (F) The nodules formed by nfre mutants at 5 wpi have a wild-type appearance, and are fully colonized by M. loti- GFP.
Figure 3—figure supplement 2. Pattern of nuclear calcium oscillations in wild-type and nfre-1 mutant.

Figure 3—figure supplement 2.

(A) Representative nuclear calcium oscillations detected in WT (left) and nfre-1 (right) cells after Nod factor treatment (10–8M). Magenta indicates short interspike interval (<85 s) and blue indicates long interspike interval (≥85 s). Dots represent successive spikes detected by CaSA software. Mean of the minimal (B), median (C), and maximal (D) interspike intervals in WT and nfre-1 cells measured by CaSA software. Error bars represent standard error of the mean. *p<0.05, Student´s t-test.
Figure 3—figure supplement 3. Transcript levels of selected genes measured by quantitative RT-PCR in Mock, or Nod factor-treated wild type, nfr1-1 and nfre mutant roots.

Figure 3—figure supplement 3.

Relative expression levels of selected genes based on the RNA seq study measured in the susceptible zone for three biological and three technical replicas are shown. The levels of housekeeping genes, ATP, UBC and PP2A were used for calculating the relative expressions. *p<0.05, Student´s t-test compared with the corresponding expression level in Mock (water)-treated samples.
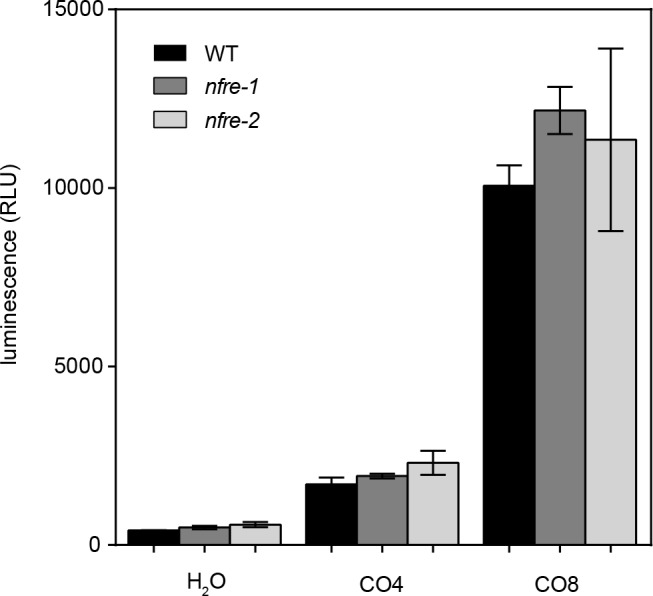
Figure 3—figure supplement 4. Chitin oligomers elicit production of similar ROS levels in nfre and wild type roots.

Figure 3—figure supplement 4.

Roots of nfre and wild type were treated with 1 μM CO4, CO8 or water then the amount of reactive oxygen species produced was followed by a chemiluminescent assay. Peak values are plotted as relative light units (RLU) and error bars represent the s.e.m. No significant difference (t-test) could be found between the mutant and wild type samples of the same treatment.