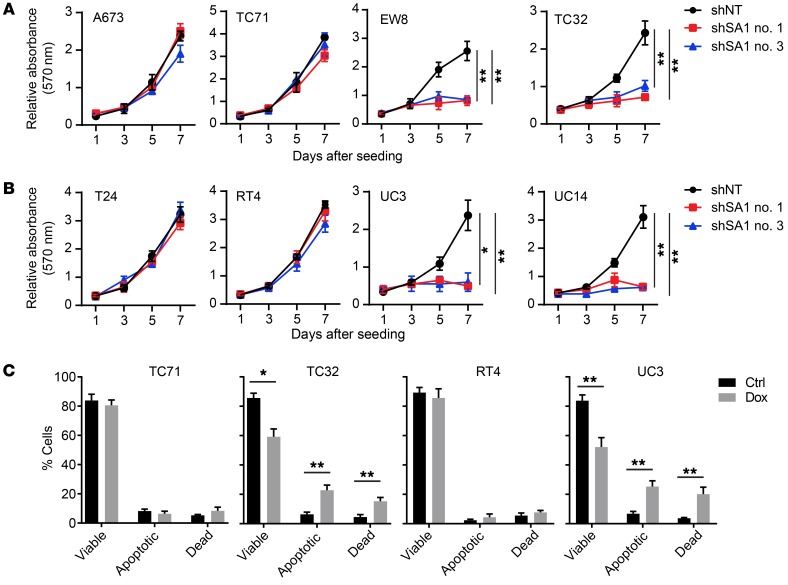
Figure 2. Depletion of SA1 inhibits the growth of SA2-mutated cells in vitro.
(A and B) Cell growth curve, based on crystal violet staining, of EWS (A) and BUC (B) cell lines expressing Dox-inducible control shRNA (shNT) or SA1-specific shRNA (shSA1). (C) Fraction of apoptotic cells in the SA2-intact (TC71, RT4) and SA2-mutated (TC32, UC3) cell lines expressing Dox-induced shSA1 for 4 days. *P < 0.05; **P < 0.01. One-way ANOVA followed by Tukey’s t test (A and B) and unpaired 2-tailed t test (C) were performed to compare different groups. Data are presented as mean ± SD and are representative of 3 independent experiments. Ctrl, control.

